Math at SJUSD: Are Our Students Being Set Up to Succeed — or Held Back?
Here's a quieter story than the school closures — and one every SJUSD family has a stake in: how the district teaches math, and how it decides which students get access to advanced courses. The data shows SJUSD students score lower than peers in nearby districts — but as you'll see, that gap is about the opportunities and support a district provides, not how capable our kids are. This is a plain-language guide to how the system works, what it means for your child, and what you can do.
CAASPP 2024–25
Same county — what access makes possible
at SJUSD
GATE funding eliminated
These numbers measure how districts perform and what they offer — not how smart or capable any student is. SJUSD's students are every bit as bright as their neighbors'. When a nearby district shows higher results, it's usually because of choices adults make — how early students can accelerate, what curriculum they use, how much support they provide. That's good news: opportunity is something a community can change. So as you read on, think of the gap not as "our kids are behind," but as "our kids deserve the same open doors" — and the rest of this page is about how to get there.
Why Math Placement Matters — and Why It's Not Just About College
It's easy to assume math placement only matters for getting into a selective university. College access is real — but it's the narrowest way to understand what's at stake. A middle-school placement decision shapes a child's options in ways that reach far beyond an admissions letter.
The UC and CSU systems require three years of college-prep math and strongly recommend four. For selective campuses and any STEM-prerequisite major, a fourth year — and ideally calculus — is effectively expected, and admissions officers weigh senior-year course rigor heavily. A student placed on the standard track in 6th grade tops out at Pre-Calculus — starting the college process with fewer of the advanced courses selective campuses look for, not for any lack of ability, but because the path was never opened.
Math course-taking is one of the strongest predictors of later earnings, and the gap is stark: in May 2021 the median wage for STEM occupations was $95,420 — more than double the $40,120 median for non-STEM jobs. And it isn't only "scientists." Nursing, finance, the skilled trades, logistics, data, and dozens of solidly-paid careers all gate on quantitative coursework. Algebra has been called "the gatekeeper for STEM" precisely because the door it controls opens onto economic mobility — not just a college major.
The deepest problem is timing. Because acceleration is sequential, a placement made in 5th or 6th grade is extremely difficult to reverse — a standard-track student literally cannot reach calculus by senior year without summer intervention they have to be invited to. A single test on a single day, scored by a formula that excludes parent and teacher judgment, can quietly foreclose options the student won't even know they lost until high school. That's not a college problem — it's a fairness problem about who gets to keep their options open.
Rigid, opaque placement doesn't fall on everyone equally. Research on districts that moved to objective, transparent acceleration criteria (Wake County, NC) found it weakened the link between course assignment and a student's race or income and strengthened the link to actual skill — and test-based acceleration measurably raised college entry and STEM-major rates for under-represented students. SJUSD runs the opposite play: a points formula that excludes parent and teacher input, applied to a district where Hispanic students sit at 19.7% math proficiency and are the same population whose schools are being closed and who are over-identified into special education. Gatekeeping isn't neutral when it consistently filters out the same kids.
To be fair: some researchers argue that calculus is over-used as a sorting mechanism and that most jobs never require the advanced math used to rank students. That critique is worth taking seriously — the goal is not to push every child into calculus. But it actually sharpens the point: if advanced math functions as a high-stakes sorting gate, then who controls access to that gate, and how transparently, is exactly what matters. A fair system keeps the door open and lets families in on the decision. SJUSD's keeps it shut by default and tells parents to "be patient."
Curriculum and placement decisions rarely make the news the way a school closure does. They're made quietly, on short timelines, in committee — and the public-comment window can be a single meeting. But these are the decisions that touch your child every single school day. Here's why staying informed isn't optional:
- The decision shapes your child's daily classroom. The curriculum the district picks determines what your child is taught, with what materials, and how — for years. If those choices are made by default (whatever is cheapest or already on hand) rather than by what works, your child lives with that choice, not the administrators who made it.
- These doors are hard to reopen. Math is sequential. A placement set in 5th or 6th grade, or a weak curriculum in middle school, compounds — by high school the gap is large and the calculus/A-G track may already be out of reach. The cost of not noticing in time is paid later, by the student.
- The district leads with its good news. Public messaging highlights the wins (a high graduation rate) and stays quiet on the harder numbers (42% math proficiency, curriculum quality, who gets accelerated). A parent who only hears the headline can miss the metric that actually predicts their child's options.
- You have rights — but only if you use them in time. Ed Code § 51224.7 lets you appeal a math placement and sign a waiver; Ed Code §§ 60002 & 60200 and the Williams Act give the public the right to review and comment on instructional materials before they're adopted. A right you don't know about is a right you can't exercise — and the comment window closes fast.
- Parent attention is the main check on the process. SJUSD's own placement formula explicitly excludes parent and teacher input. The one thing the district can't design out is a parent showing up — asking for your child's placement data, asking for the adoption timeline, speaking at a Board meeting. Informed parents are the accountability.
Following this isn't about district politics. It's about keeping your own child's options open while there's still time to act.
How SJUSD Compares to Its Neighbors
| District | Math Proficiency | Gap vs. SJUSD |
|---|---|---|
| Cupertino Union SD | 84.5% | +42.5 pts |
| Los Gatos Union Elementary | ~72% | +30 pts |
| Cambrian SD | ~61% | +19 pts |
| Santa Clara Unified | 49.5% | +7.5 pts |
| Campbell Union SD | ~45–48% | +3–6 pts |
| San Jose Unified | 42.0% | — |
| California State Average | 37.3% | -4.7 pts |
Demographic gaps within SJUSD reveal who is being left behind:
| Student Group | Math Proficiency |
|---|---|
| Asian | 81.9% |
| White | 63.2% |
| African American | 25.0% |
| Hispanic | 19.7% |
| Economically disadvantaged | 17.0% |
SJUSD's math proficiency has been essentially flat for four years: 39.5% → 38.6% → 39.6% → 40.9% → 42.0%. There is no improvement plan, no urgency, and no public strategy to close the gap with neighboring districts.
The Math Placement System: A Point-by-Point Breakdown
SJUSD published its Middle School Math Placement Criteria and Process (2024–25), an 8-page document that lays out a point-based system for determining which students can take accelerated math. Here is what it says — and what it means for your child.
To enter Accelerated Math 6, a rising 6th grader needs 5 or more points across three measures:
| Measure | Criteria | Points |
|---|---|---|
| CAASPP (grade 4 or 5, higher score) | Score of 4 / Score of 3 | 2 / 1 |
| NWEA Spring RIT (grade 5) | ≥90th percentile / ≥80th / ≥70th | 3 / 2 / 1 |
| 5th grade progress report | Making adequate progress | 1 |
Maximum possible: 6 points. Students with 4 points can take a challenge assessment. Below 4 = standard track, no exceptions.
For 7th grade: 5 points = Accelerated Math 7; 6+ points = Algebra 1. Adds course grade (A/B = 2pts, C = 1pt) and prior accelerated course (1pt).
For 8th grade: 5+ points = direct to Algebra 1 (skipping Ramp Up). Same measures plus prior course history.
What This Means: A Student Scoring in the 85th Percentile Nationally Can Be Denied
Consider a real scenario from the district's own examples:
A 5th grader scores in the 85th percentile on NWEA (better than 85% of students nationally), earns a CAASPP Score of 3 ("Met Standard"), and is making adequate progress per their teacher. Their points:
- CAASPP Score 3 = 1 point
- NWEA 85th percentile = 2 points
- Adequate progress = 1 point
- Total: 4 points — NOT accelerated
This student outperforms 85% of students in the country. At Cupertino, they would be on the accelerated track. At SJUSD, they are placed in standard Math 6 — and told to "be patient."
What the District Explicitly Refuses to Consider
Page 6 of the placement document lists what is not part of the process:
- Prior year math teacher's recommendation — the person who knows your child best academically
- Current math teacher's recommendation
- Parent's request — your voice is explicitly excluded
- Private or independent assessments — Kumon, tutoring, community college courses don't count
- Available space in accelerated courses — even if seats are empty, students who don't meet the points aren't moved up
California Education Code § 51224.7 (the Mathematics Placement Act of 2015) gives parents specific rights that appear to conflict with SJUSD's stated policy:
- Placement must use multiple objective academic measures — applied uniformly regardless of race, socioeconomic background, or gender
- Students must receive at least one reevaluation within the first month of the school year
- Parents have the right to appeal placement decisions to the Superintendent
- Parents may sign a voluntary waiver to place their child in a different course against the district's recommendation
SJUSD's placement document makes no mention of the voluntary waiver option. The FAQ tells parents who disagree with placement: "We encourage you to be patient and supportive of your child." Know your rights.
The Standard Path Cannot Reach AP Calculus
SJUSD's own document shows the four most common high school math pathways:
| Last Middle School Course | 9th | 10th | 11th | 12th |
|---|---|---|---|---|
| Math 8 (standard) | Algebra 1 | Geometry | Algebra 2 | Pre-Calculus only |
| Math 8 + Summer Ramp Up | Geometry | Algebra 2 | Pre-Calculus | AP Calc or AP Stats |
| Algebra 1 (accelerated) | Geometry | Algebra 2 | Pre-Calculus | AP Calc or AP Stats |
| Geometry (most accelerated) | Algebra 2 | Pre-Calculus | AP Calc or AP Stats | Multi-variable Calc |
If your child is on the standard track and doesn't get invited to the summer Ramp Up program (invitation-only, requires CAASPP 3+, NWEA ≥70th, AND A or B grade), AP Calculus is off the table. The door to competitive college admissions in STEM closes in middle school — based on a points formula that excludes parent and teacher input.
"But Our Graduation Rate Is High" — Why That's the Floor, Not the Finish Line
When questioned about academics, the district often points to its graduation rate — around 94%. That number is genuinely good and worth recognizing. But a high graduation rate and weak math outcomes can both be true at once — because a diploma measures a minimum, not readiness.
In California, the bar to graduate is deliberately low — it's meant to be a floor every student can clear:
- A diploma requires only a D or better in required courses, and as little as two years of math.
- A–G eligibility — the bar to even apply to a UC or CSU — requires a C or better and three years of math (four recommended). A student can graduate with D's in math and still be ineligible for any California public university.
- Statewide, only about 54% of graduates complete A–G and roughly 52% are rated "college/career ready" on the state Dashboard — far below the graduation rate. The diploma and readiness are simply not the same measure.
You can see the gap inside SJUSD's own numbers: a ~94% graduation rate sits right next to 42% math proficiency — meaning 58% of students are below grade level in math yet still on track for a diploma. That's not a contradiction; it's exactly what happens when a diploma doesn't require proficiency. And it connects directly to placement: a student tracked out of acceleration in 6th grade can still graduate on time — but may never finish the A–G math sequence or reach calculus. The diploma says "done." The transcript quietly says "not ready for college STEM."
So when the district highlights graduation, the questions that actually measure your child's future are: What is our A–G completion rate? What share of graduates are college/career ready? What share are proficient in math? Graduation is the floor every student deserves. Readiness is the goal — and that's where the district's data shows the real gap.
The Curriculum Is Being Retired — and There's No Public Plan to Replace It
SJUSD uses College Board's SpringBoard curriculum for Math 6 through Algebra 2. This isn't a curriculum the district is choosing to keep or drop — College Board is sunsetting SpringBoard entirely. Per College Board's own timeline:
- New orders were accepted only through the 2025–26 school year, and professional-learning support ends May 31, 2026 — after which College Board no longer trains teachers on it.
- The high school edition was rated "Does Not Meet Expectations" by EdReports — it failed the very first gateway (Focus & Coherence / alignment to the standards) so decisively that reviewers never even scored it for rigor or usability. Continuing it was never a strong option.
- That means SJUSD must adopt a new math curriculum for 2026–27 — yet as of this writing the district has published no replacement, no selection committee, no timeline, and no parent-input process.
SJUSD's math page states that "Mathematics instruction is guided by the California Common Core State Standards (CCSS)." That is a statement about the standards — the skills every California district must teach — not about the SpringBoard product. A few things follow:
- Common Core alignment is the floor, not a feature unique to SpringBoard. Any replacement SJUSD adopts will also be CCSS-aligned — that's a state requirement. Cupertino's CPM curriculum is CCSS-aligned too, and it earned an all-green EdReports rating while SpringBoard's high school edition did not.
- The leading independent reviewer actually contradicts the district's claim. EdReports' first gateway evaluates exactly what the district points to — alignment to the standards (focus and coherence). SpringBoard's high school edition did not meet that gateway, failing so early that rigor and usability were never scored. "Aligned to Common Core" is the district's framing; the most-cited independent curriculum review found the materials do not adequately meet the high school standards.
- "Continuing" it isn't on the table. Because College Board is retiring the program, staying with SpringBoard would mean running an unsupported, out-of-print product with no publisher training. The real question isn't whether to keep it — it's which CCSS-aligned, high-rigor curriculum replaces it, and how that choice gets made.
So "it's aligned to Common Core" doesn't answer the question — it sidesteps it. Alignment is required by law; what's missing is a transparent, public adoption process.
- What curriculum will replace SpringBoard for Math 6–Algebra 2 in 2026–27?
- Who is selecting it? Is there a curriculum-adoption committee, and who sits on it — teachers, administrators, parents, community members?
- What is the timeline? California's instructional-materials process normally includes pilots, public review of sample materials, and a Board adoption vote. Where is SJUSD in that process — months before the product it relies on loses support?
- Will parents have input? State law (the Williams Act and Ed Code §§ 60002, 60200) gives the public the right to review and comment on instructional materials before adoption. Has SJUSD scheduled any public review or comment period?
If you know of a selection committee or adoption timeline that hasn't been made public, tell us — we'll update this page. As of now, none has been posted.
The Connection to School Closures: Closing Buildings, Not Closing Gaps
Since September 2025, nearly all Board and staff energy has gone into the Schools of Tomorrow closure process. During this same period:
- Math proficiency has been flat for 4 years — no improvement plan has been presented to the Board
- No math enrichment, gifted programs, or competition teams exist at the district level — GATE funding was eliminated
- The math curriculum is being discontinued with no public replacement plan
- Hispanic students — 19.7% math proficiency — are the same population whose schools are targeted for closure and who are being over-identified into special education (sig dis)
- The district's "ideal school" criteria measure class sections per grade — not academic outcomes, not test scores, not student growth
The district is asking the community to accept irreversible school closures as a path to "better educational experiences." But where is the evidence that SJUSD has any plan to improve math instruction? What specific programs will the "ideal" consolidated schools offer that current schools cannot? The district has never answered this question — because the closures aren't about academics. They're about headcount.
Cupertino Union School District serves families just miles from SJUSD and achieves 84.5% math proficiency — double SJUSD's rate. Here is what they do that SJUSD does not:
- Publishes exact NWEA RIT score thresholds (235–260+) — not just percentiles — so families know exactly what their child needs
- Allows Algebra 1 in 7th grade and Geometry in 8th grade — SJUSD's most accelerated path reaches Geometry in 8th only from Accel Math 6
- Has a majority of middle schoolers two years ahead in math — a fundamentally different philosophy from SJUSD's restrictive gatekeeping
- Uses CPM (College Preparatory Mathematics) for middle school — rated all-green by EdReports
The difference isn't demographics or funding — it's philosophy. Cupertino assumes students can succeed in advanced math and provides pathways to get there. SJUSD assumes they can't and builds barriers to prove it.
Your involvement matters more than the district wants you to think. Here are concrete steps:
- Request your child's placement data. The district is required to show you the points used to determine their math placement. Ask your school principal for the breakdown.
- Know your rights under Ed Code § 51224.7. You can appeal placement to the Superintendent. You can sign a voluntary waiver to place your child in an advanced course. The district may not tell you this — but it is state law.
- Ask about the NWEA percentile discrepancy. The district uses National RIT norms, not the percentile on your child's report. Ask which percentile they used and how it was calculated.
- Demand a math improvement plan at Board meetings. The district has presented dozens of closure options but zero plans to improve math instruction. Ask: what is the strategy to close the 42-point gap with Cupertino?
- Ask what curriculum will replace SpringBoard. It's being discontinued in 2026–27. What is the plan? Who is involved in selecting the replacement? Will parents have input?
- Connect with other parents. The math placement process affects every family in the district. If your child was denied acceleration, you are not alone — and the data suggests the system is working as designed to limit access, not expand it.
The question every parent should ask the Board: You want to close our schools to create "ideal" schools — but your own data shows 58% of students can't do math at grade level, the gap with neighboring districts is growing, and you have no plan to fix it. How does closing buildings help our children learn math?
The Full Picture: SJUSD on California's 2025 School Dashboard
California grades every district on its official School Dashboard, color-coding each measure from Red (lowest) to Blue (highest). Each color blends two things: how students are doing now (status) and whether it's improving (change). Here is San José Unified's 2025 report card — and read alongside the math analysis above, it tells a consistent story.
A color isn't a grade on effort — it's a blend of current results and recent change. That matters, because a measure can earn a "better" color while students are still far from grade level, simply because scores ticked up. Keep that in mind as you read on.
Math: a Yellow that's better than it looks
The Dashboard rates SJUSD math Yellow — but the number underneath is 26.9 points below the "standard met" line. Compare English Language Arts, rated a worse color (Orange) despite being only 5.1 points below standard. Why is math — roughly five times further below grade level — the "better" color? Because math scores rose 3.6 points while ELA held flat, and the color rewards movement. The Yellow reflects real progress, but it understates how far there still is to go — exactly the "read past the headline" lesson from the graduation section above.
The trend confirms it: math has climbed back since 2023 (−34.1 → −30.4 → −26.9 points from standard) but is still further below grade level than in 2019 (−20.9). Progress, not arrival.
Behind the district average: the same students, again
That single Yellow hides who is carrying the gap. In math, 8 of 12 student groups land in the bottom two colors — 3 Red and 5 Orange — while the district average is buoyed by a few groups well above standard:
| Math — points from standard (2025) | Group |
|---|---|
| Red — furthest below | Homeless (−168) · Foster Youth (−147) · Socioeconomically Disadvantaged (−96) |
| Orange — well below | Long-Term English Learners (−169) · Students with Disabilities (−124) · English Learners (−97) · Hispanic (−89) · African American (−73) |
| Green / Blue — at or above | Asian (+90) · Two or More Races (+33) · White (+29) · Filipino (+4) |
This is the same pattern the placement analysis predicts and the Significant Disproportionality section documents: opportunity and support — not ability — track with income, language, and disability. The work isn't to fix the students; it's to open the same doors for every group.
Graduation is Green. Readiness is the real test.
Two Green indicators sit side by side and look like unqualified good news: a 92.2% graduation rate and 57.4% "prepared" on the College/Career indicator. The readiness jump is genuine — up from 38.6% in 2019, a real bright spot. But the ~35-point gap between graduating and being prepared is precisely the "floor, not the finish line" point: a diploma is the minimum; readiness is the goal. And readiness is wildly uneven — only 15.3% of English Learners, 19.7% of students with disabilities, and 11.6% of homeless students reach "prepared."
The Dashboard doesn't contradict this page's math analysis; it confirms it from the state's own scoreboard. Math is improving but still well below grade level (−26.9). The flattering Yellow color is exactly why you have to read past the headline number. And the gaps fall on the same students every time — low-income, English learners, foster and homeless youth, students with disabilities — across math, attendance, and college readiness. Improvement is real; equity is the unfinished work. The encouraging part: these are fixable through adult choices — curriculum, course access, attendance support, and targeted investment — not anything lacking in the kids.
Where SJUSD Could Do Better — Beyond Math
The same Dashboard points to clear, winnable next steps in other areas:
- Chronic absenteeism (Orange, 20.3%). Worse than the state (17.1%) and still double the pre-pandemic 9.8%. Foster Youth (56.5%) and homeless students (58.1%) are chronically absent at staggering rates. The district credits home visits for a 5.2% decline — scale that program, tier attendance interventions, and rebuild the school connectedness its own climate survey says is slipping.
- English Language Arts (Orange) — the lowest-colored academic measure. Math gets the attention, but 8 of 12 groups are Orange in ELA. SJUSD needs an evidence-based literacy plan too — early K–2 reading screening and intervention, science-of-reading practices, and ELD woven into literacy.
- English Learner progress (Yellow, below state). ELs are 22% of students, and Long-Term ELs sit at −169 in math. Strengthen designated/integrated ELD and stop the long-term-EL pileup. Note the bright spot: recently reclassified students thrive (+3.4 in ELA) — so faster, well-supported reclassification works.
- Readiness for the underserved. Expand A–G access and CTE pathways for the groups stuck far below "prepared" — English Learners (15%), students with disabilities (20%), homeless youth (12%).
- Discipline equity. American Indian (Red, 9.3% and rising), African American (7.2%), and Foster Youth (11.8%) are suspended well above peers. Invest in restorative practices and behavior supports for these groups.
- Put the federal CCEIS money to work. Because of the Significant Disproportionality finding, SJUSD must already reserve 15% of its IDEA funds for early intervention (see that section). Direct it precisely at the groups showing Red here — that's not extra budget, it's a legal obligation already on the books.
Significant Disproportionality: SJUSD Flagged 3 Years Running for Over-Identifying Hispanic Students
The California Department of Education has identified San José Unified as significantly disproportionate under federal IDEA law for three consecutive years — meaning the district places Hispanic students into special education at rates far exceeding other groups. Despite being required to act, SJUSD has produced no public corrective plan.
The Timeline: Three Strikes, No Action
- 2022–23: First identification — Hispanic and Native American students with Specific Learning Disability
- 2023–24: Identified again — same pattern persists
- 2024–25: Identified a third year — Hispanic students with Specific Learning Disability
What the Law Requires
Under federal law (IDEA §618(d)), when a district is flagged for significant disproportionality, it must:
- Reserve 15% of IDEA funds for Comprehensive Coordinated Early Intervening Services (CCEIS)
- Submit an Assurances Form within 30 days of identification
- Complete a 4-step Compliance and Improvement Monitoring (CIM) process: (1) Gather & Inquire, (2) Investigate root causes, (3) Plan for Results, (4) Implement & Monitor
- Submit a CCEIS plan and annual addendums tracking progress
Three Years and Counting — What Has SJUSD Done?
Despite being flagged since 2022, there is no publicly available CCEIS plan from SJUSD. The district's LCAP and LCAP Federal Addendum contain no mention of significant disproportionality, CCEIS, or corrective actions for Hispanic over-identification in special education. For comparison, San Francisco Unified publishes its full CCEIS plan online with transparent root-cause analysis and action steps.
The CIM process has no hard deadline to achieve results — improvement is tracked through annual amendments, and CDE provides technical assistance rather than sanctions. This means a district can remain on the list year after year with minimal public accountability. SJUSD has now been flagged for three consecutive years with no visible improvement and no public plan.
Cambrian School District, a smaller district in the same county, was flagged for the same issue — Hispanic students with Specific Learning Disability — in 2023–24 and 2024–25. Unlike SJUSD, Cambrian took public, documented action:
- Created LCAP Action Item 1.12 — "Addressing Disproportionality for Students with Disabilities, English Learners, and Hispanic Students" — explicitly following CDE's CIM process for CCEIS
- Reserved $108,575 in IDEA funds for 2025–26 (and $112,000 in 2024–25) specifically for CCEIS services
- Engaged parents of students with IEPs through input meetings and an annual needs assessment survey
- Self-identified in their LCAP as "Targeted Level 2 for Disproportionality" with a finding of noncompliance in the Timeline Noncompliance Review
- Published progress updates acknowledging the plan is "still in development" with "early parent engagement efforts and systems refinement underway"
Cambrian serves ~3,056 students. SJUSD serves ~32,000. If a district one-tenth the size can publicly acknowledge its sig dis finding, budget corrective funds, and report progress in its LCAP — why can't SJUSD?
San Francisco Unified School District, a large urban district also flagged for significant disproportionality — with Black/African American, Latinx, and Pacific Islander students over-identified — took comprehensive, publicly documented corrective action:
- Created a dedicated 6-person CCEIS team led by Director Matthew Fitzsimons and Dr. Talya Huntley, housed within the Special Education department
- Developed and published a CDE-approved 2025 CCEIS Plan detailing root cause analysis, targeted interventions, and measurable outcomes
- Launched the Shoestrings Program — a wraparound early childhood intervention developed in partnership with Stanford's Early Childhood Institute, focused on pre-referral supports in general education
- Redirected 15% of its IDEA special education funds to CCEIS activities serving students in general education — exactly as federal law requires
- Hosted a CCEIS Summit in October 2025 bringing together educators, families, and community partners to review progress and align strategies
- Published full transparency online with a dedicated webpage detailing their CIM process, sig dis findings, and corrective actions
SFUSD serves ~49,000 students — larger than SJUSD. If San Francisco can build a full CCEIS infrastructure with dedicated staff, a Stanford partnership, and public reporting — what is SJUSD's excuse?
The connection between significant disproportionality and the Schools of Tomorrow closures is direct:
- The schools targeted for closure are disproportionately in downtown and East San Jose — the same neighborhoods where Hispanic students are concentrated
- SJUSD is already closing Special Day Class (SDC) programs at Graystone, Schallenberger, and Empire Gardens — consolidating them into just 3 schools (Washington, Grant, Allen at Steinbeck). Parents were notified by email without prior consultation
- Trustee Nicole Gribstad's request to add the SDC consolidation issue to the March 27 board agenda was denied
- The district is simultaneously flagged for over-identifying Hispanic students into special education and closing the schools that serve those same students
Broader Disparities at SJUSD
ProPublica's Miseducation project documents additional disparities across the district:
The pattern is clear: SJUSD over-identifies Hispanic students for special education, under-enrolls them in AP and gifted programs, suspends Black students at 3× the rate of White students, and is now closing the schools that serve these communities — all while failing to produce a public corrective action plan after three years on the state's watch list.
The Paradox: More Money, Fewer Students, Closing Schools
San José Unified ran healthy surpluses of $25.7M (2022–23) and $18.9M (2023–24) on general fund revenues of $476M and $504M respectively. Then for 2024–25, the district projects just $462 million in revenue while budgeting $492 million in expenditures — a $30 million deficit budget. That's a $49 million swing in two years. Over the past decade, enrollment dropped by more than 6,000 students — a 20% decline. Despite having more money per student than ever before, the district now says it must close up to 9 elementary schools.
This website breaks down the publicly available financial data so you — parents, teachers, taxpayers, and community members — can understand where the money comes from, where it goes, and whether closing schools is truly the only option.
Revenue: Where Does the Money Come From?
Before diving into the numbers, it helps to understand how California school districts get their money. It's not as simple as "the government pays for schools." There are multiple streams, complex formulas, and a critical distinction that makes SJUSD different from most districts in the state.
How the Money Flows to Your School
Where SJUSD's Money Actually Comes From (2024–25)
Here's how the $462 million general fund budget breaks down by source. Notice how dominant property taxes are — that single blue slice is 85 cents of every dollar.
$390.9M
$46.6M
$14.1M
$10.5M (grants, parcel taxes)
The Key Formula: LCFF (Local Control Funding Formula)
Since 2013, California has funded schools through the LCFF. Here's the simple version: the state calculates a per-student funding target for every district, then checks how much the district already collects in local property taxes. If there's a gap, the state fills it.
SJUSD became a Basic Aid district in 2020–21. In Silicon Valley, where home values are among the highest in the nation, property tax revenue is enormous. This means SJUSD's funding is tied to property values, not student headcount. When families leave the district, the money doesn't leave with them. About 10% of California districts have this status.
The question this raises: If losing students doesn't mean losing money, why is the district claiming a financial crisis that requires closing schools?
Revenue Over 10 Years (General Fund)
The table below shows how SJUSD's financial position has grown year after year, even as enrollment fell. Important note: The NCES-reported $532M figure for 2021–22 is all-funds total revenue (including capital and special funds), not general fund alone. The 2024–25 data comes from SJUSD's own LCAP Budget Overview filed with CDE — this is a general fund figure of $462M.
| Fiscal Year | Total Revenue | Year-over-Year | Enrollment | Source |
|---|---|---|---|---|
| 2014–15 | $321M | — | ~30,800 | SVTA / Ed-Data |
| 2015–16 | $337M | +5.0% | ~31,000 | Ed-Data (est.) |
| 2016–17 | $355M | +5.3% | ~30,700 | Ed-Data (est.) |
| 2017–18 | $370M | +4.2% | ~30,500 | Ed-Data (est.) |
| 2018–19 | $385M | +4.1% | ~29,600 | Ed-Data (est.) |
| 2019–20 | $397M | +3.1% | ~28,800 | Ed-Data (est.) |
| 2020–21 ★ | $430M | +8.3% | ~26,300 | Ed-Data (est.) |
| 2021–22 | $532M ★★ | +23.7% | ~25,700 | NCES CCD (all-funds) |
| 2022–23 | $476M (GF) | −10.5% | 25,451 | CDE SACS Unaudited Actuals |
| 2023–24 | $504M (GF) | +5.7% | 25,976 | CDE SACS Unaudited Actuals |
| 2024–25 ④ | $462M (GF) | — | 25,409 | SJUSD LCAP Budget Overview (CDE) |
★ SJUSD became a Basic Aid (locally funded) district. Blue-shaded rows include significant federal ESSER relief funding.
★★ $532M is the NCES-confirmed all-funds total revenue for FY 2021–22. General fund revenue alone is lower.
③ 2022–23 GF actuals: Revenue $476.4M, Expenditures $443.0M — surplus of $25.7M. 2023–24 GF actuals: Revenue $503.6M, Expenditures $476.9M — surplus of $18.9M. Both from CDE SACS Data Viewer, Unaudited Actuals (viewer.sacs-cde.org).
④ 2024–25 general fund revenue: $462,171,756 — from SJUSD's official LCAP Budget Overview filed with CDE (PDF). Breakdown: LCFF $390.9M (85%), Other state $46.6M (10%), Local $10.5M (2%), Federal $14.1M (3%). Budgeted expenditures: $492,473,846 — a $30.3M deficit budget.
⑤ The trend: Surpluses shrank from $25.7M (2022–23) → $18.9M (2023–24) → then the district budgeted a $30.3M deficit for 2024–25 — a $49M swing in two years. Revenue dropped $41M while spending barely moved.
Related spending data (from Mercury News editorial, Mar 2025): Expenditures rose from $366M (2019–20) to $492M (2023–24) — a 34% increase in 5 years while enrollment fell 13% and inflation rose 20–22%.
SJUSD's general fund revenue peaked at $504 million in 2023–24 — up from $321 million a decade earlier — even as the district now serves about 5,400 fewer students. The district ran healthy surpluses of $25.7M (2022–23) and $18.9M (2023–24). Then for 2024–25, revenue dropped $41 million to $462M while spending barely changed — producing a $30.3 million deficit budget. That's a $49 million swing in two years. Where did the money go?
Spending: Where Does the Money Go?
According to the Mercury News editorial board (March 2025), SJUSD expenditures increased from $366 million in 2019–20 to $492 million in 2023–24 — a 34% increase in just five years. During that same period, enrollment declined 13%. The number of district employees actually went up slightly, by 0.4%.
Where Every Dollar Goes
When SJUSD receives $462 million, here's how it gets divided up. Think of it like a household budget — but with half a billion dollars and 25,000 kids depending on it.
About 75 cents of every dollar goes to people — salaries and benefits. This is normal for school districts. But it means when costs rise (pension rates, healthcare premiums, negotiated raises), they rise fast — and there's very little room to cut without cutting staff. The question is whether SJUSD's staffing levels are right-sized for 25,000 students when they were built for 31,000.
According to U.S. News Education, SJUSD spends about $16,520 per student per year. The major spending categories break down roughly as follows:
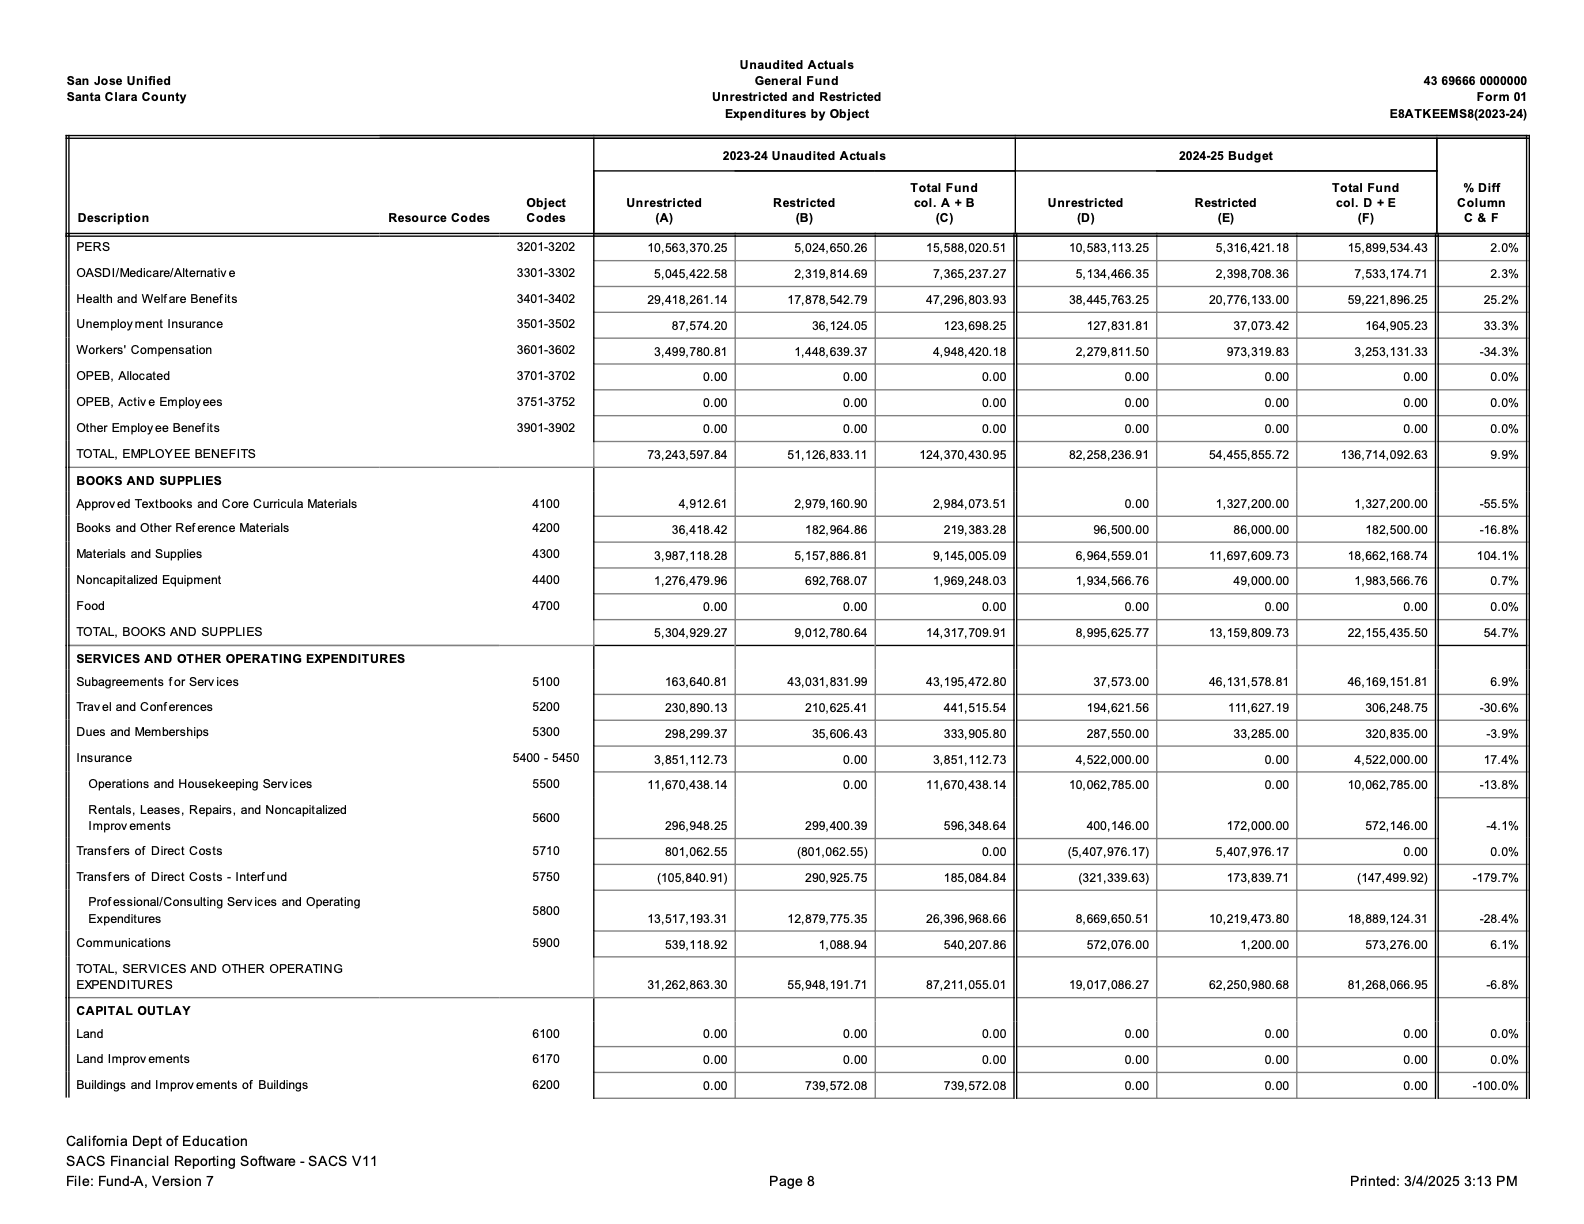
The Employee Benefits Explosion
One major cost driver has been employee benefits — pensions (CalSTRS, CalPERS), retiree healthcare, and other benefits. A 2017 analysis by David Crane noted that employee benefits at SJUSD grew from $58.6 million in 2013–14 to $70 million in 2014–15 — a 19% jump in a single year. By 2019–20, benefits were projected to consume 25% of all district revenue.
In 2025, three unions (SJTA, CSEA, and AFSCME) accused SJUSD of underfunding employee health and welfare benefits by over $30 million since 2017–18. According to the unions, the district quietly switched from using the authorized number of employee positions to only the number of filled positions when calculating benefit contributions — resulting in millions of dollars not reaching the employee Health and Welfare Fund. SJUSD Chief Business Officer Seth Reddy acknowledged the issue and said the district was "committed to making this right."
🚨 The Reserve Crisis: SJUSD's Empty Safety Net
California law requires every school district to maintain a minimum "Reserve for Economic Uncertainties" — essentially a rainy-day fund. For districts SJUSD's size (over 1,000 ADA), the state-recommended minimum is 2% of total expenditures. This is codified in Title 5 of the California Code of Regulations and monitored by the County Office of Education.
Here's how SJUSD measures up, based on the district's own filings with the state:
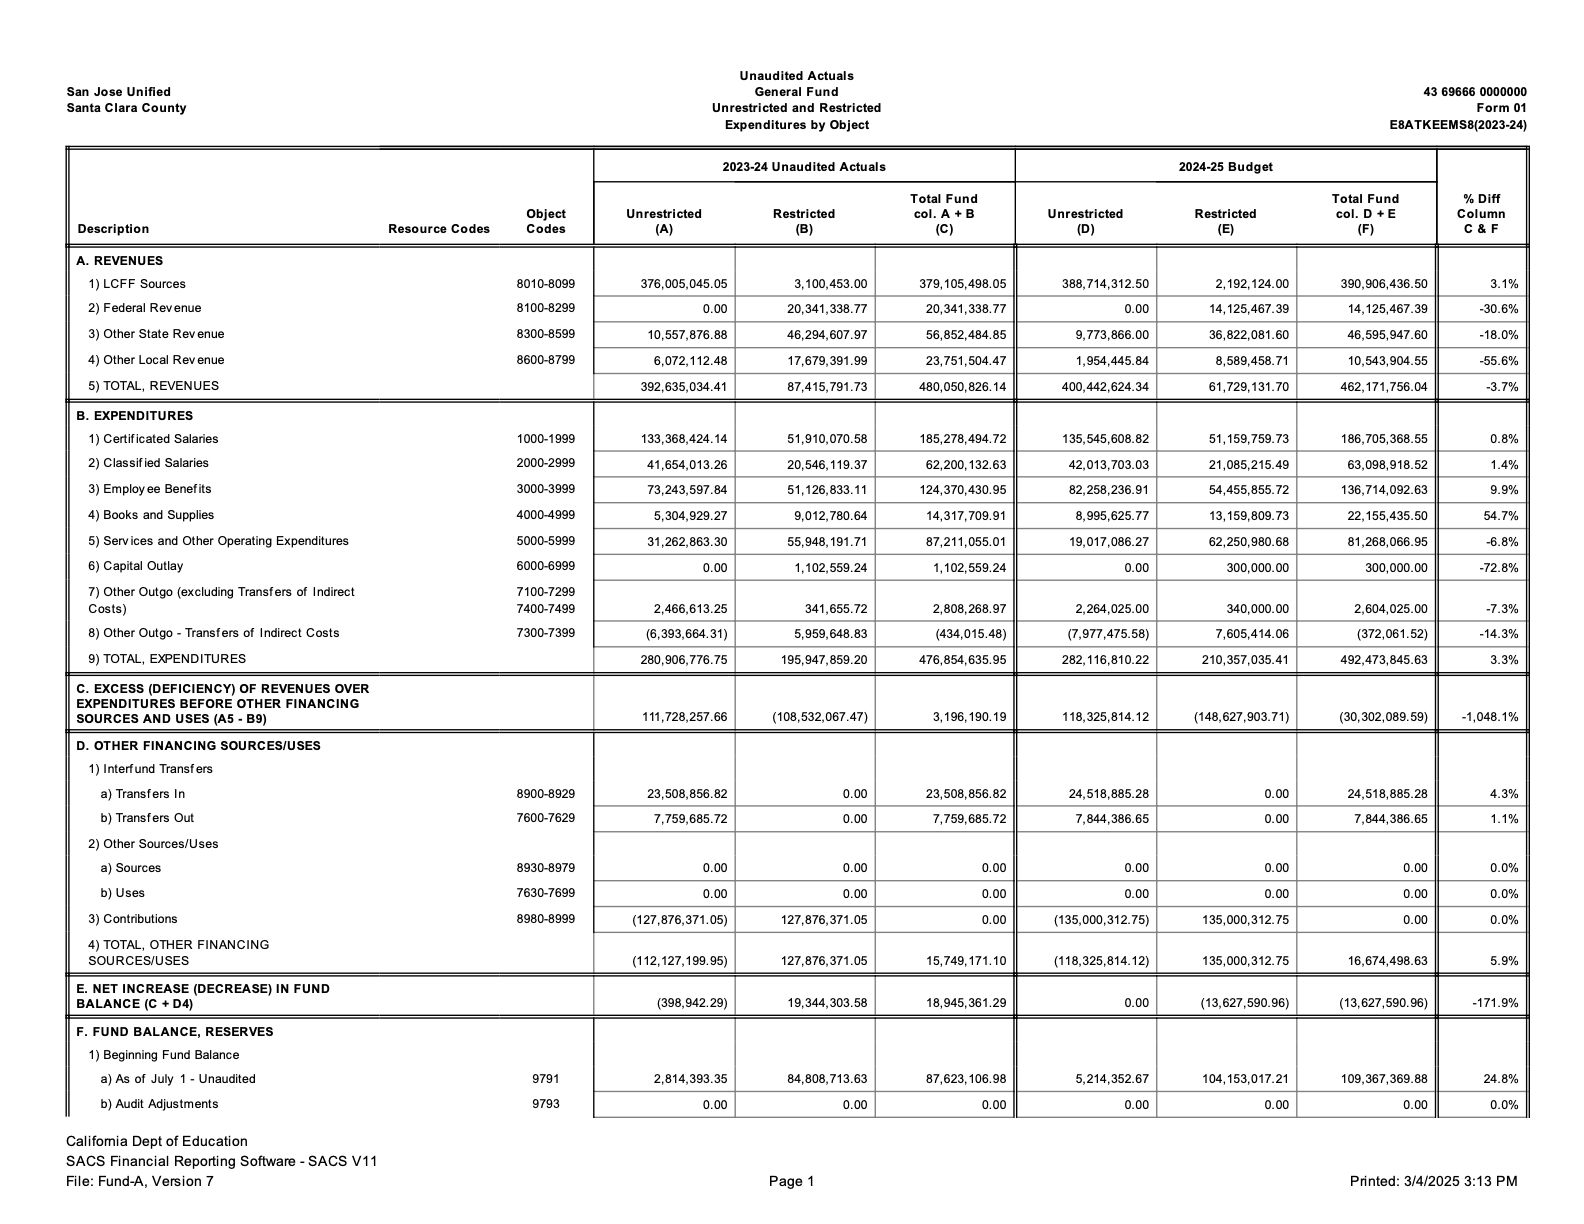
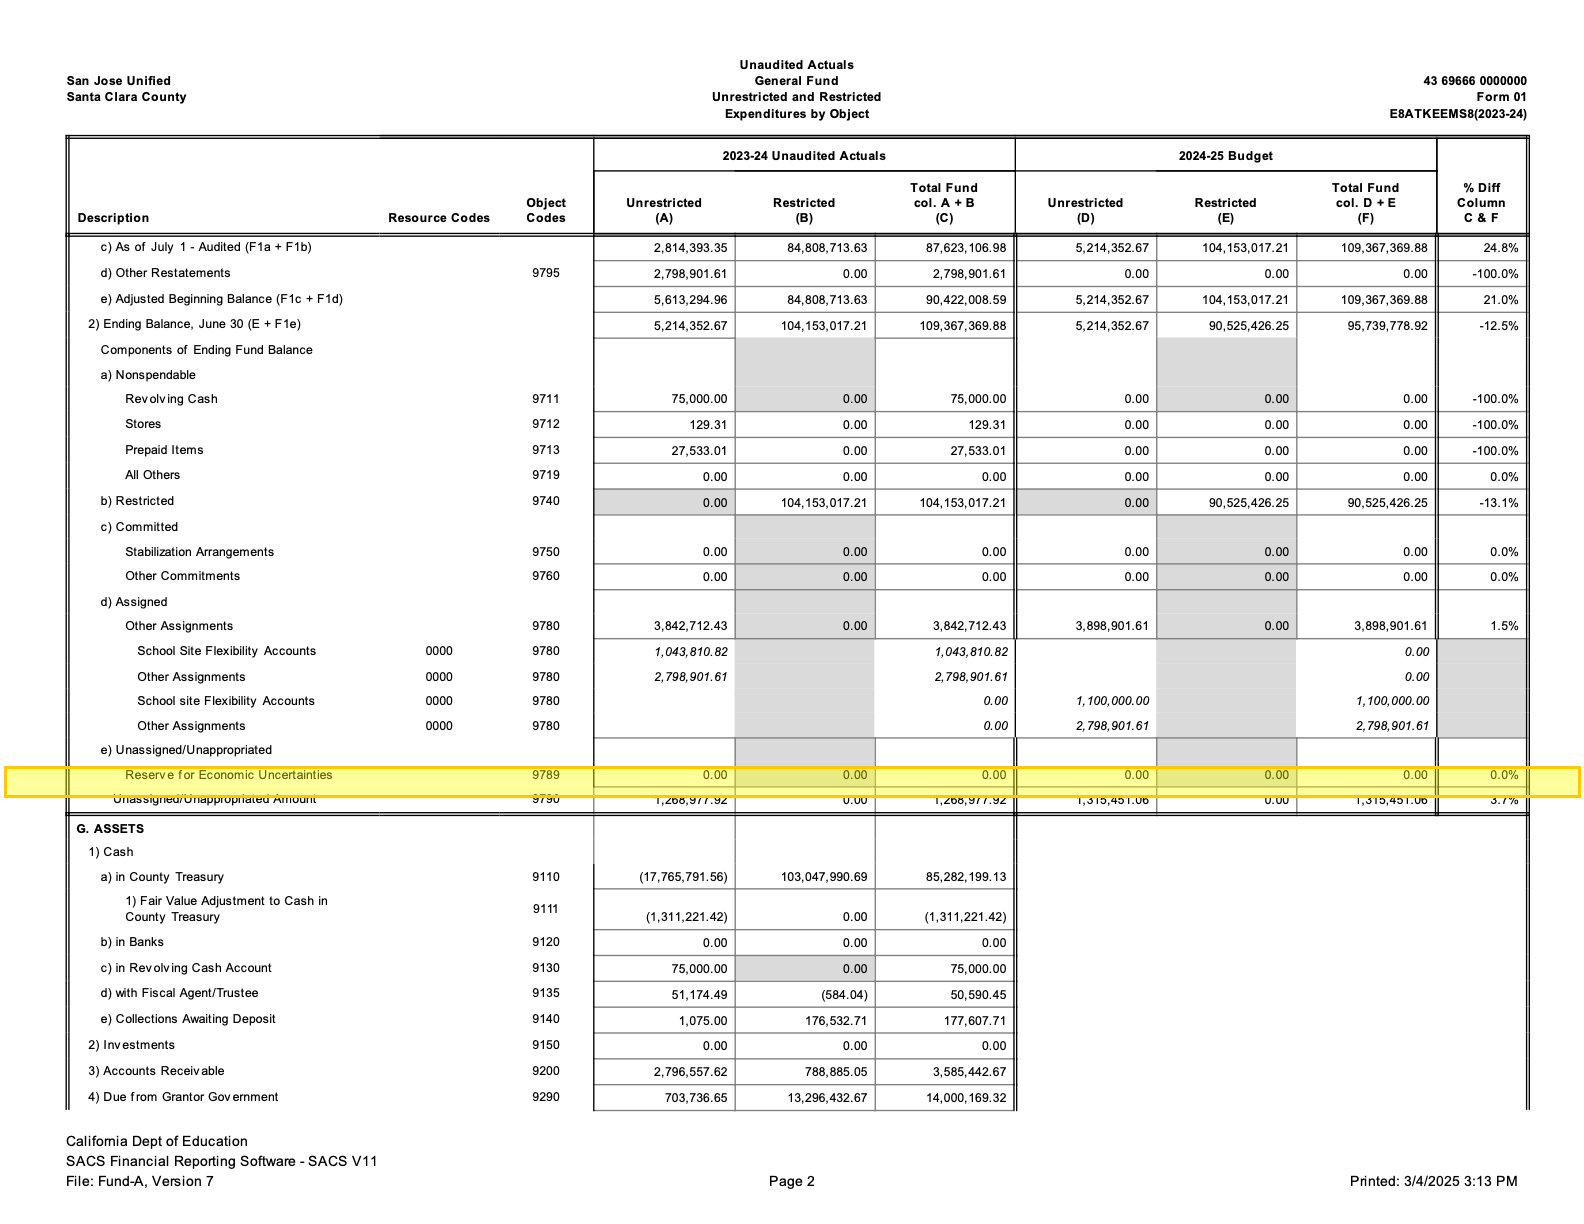
SJUSD's total ending fund balance was $109,367,369 in 2023–24. But $104.2M of that is restricted — legally earmarked for specific programs (special education, federal grants, etc.) and cannot be used for general operations. Only $5.2M is unrestricted, and of that, $3.8M is assigned to specific commitments, $0.1M is nonspendable, leaving just $1.27M unassigned. The designated Reserve for Economic Uncertainties line item (Object Code 9789) shows $0.
The $104.2M restricted includes: $48.1M Other Restricted Local, $21.5M Learning Recovery Emergency Block Grant, $15.1M Arts/Music Block Grant, $7.0M Expanded Learning, and $3.6M maintenance accounts. None of this can be redirected to fill operating deficits.
This means SJUSD has been operating below the state-recommended minimum reserve for at least two consecutive years. The County Office of Education is supposed to flag this. A district running a $30.3M deficit in 2024–25 with essentially no unrestricted reserves is in serious fiscal danger.
The Unaudited Actuals reveal a massive spike in employee benefit costs that helps explain the deficit:
Health and welfare benefits alone jumped $11.9 million in a single year — a 25.2% increase. Total employee benefits rose from $124.4M to $136.7M (+9.9%). This aligns with union claims of $30M+ in underfunded benefits since 2017–18. The question is: why were these costs not planned for, and why are school closures the proposed solution?
Management Salaries: Who Gets Paid What
The SACS data lets us break down exactly where every salary dollar goes. In 2023–24, SJUSD's general fund spent $247.5 million on salaries and another $124.4 million on benefits — totaling $371.8 million, or 78% of all expenditures, on people costs alone.
SJUSD lists 13 senior leaders on its management page, headed by Superintendent Nancy Albarrán (in the role since 2016). The team includes a Chief Business Officer, Associate Superintendent, Assistant Superintendent, and 9 Directors overseeing everything from finance to data strategy to communications.
Based on SACS data and NCES headcounts, the average administrator salary (cert + classified, 99.5 positions) is approximately $215,000/year. The average teacher salary (1,189 FTE) is approximately $120,400/year. Superintendent Albarrán's total compensation was $367,302 in 2020 (most recent public data) — and has likely increased since.
SJUSD employs 23 district-level administrators and 76.5 school-level administrators for 25,000 students. That's one administrator for every 251 students. Combined admin salaries total $21.4 million/year. Meanwhile, the district says it must close neighborhood elementary schools to save money. How much would the district save by reducing administrative headcount by 10–15% instead of — or in addition to — closing schools?
Spending 2019–20
~28,800 students
Spending 2024–25 (Budget)
Revenue: $462M
$30.3M deficit budget
Enrollment: The Shrinking Student Body
The district's enrollment has been on a steady downward trajectory. In 2008, SJUSD served approximately 35,000 students. By 2017–18, that had dropped to about 30,500. Today (2024–25), enrollment is approximately 25,409 — a loss of roughly 10,000 students since 2008, or 6,000+ since 2017–18.
The district attributes this to Silicon Valley's high cost of living pushing families out, declining birth rates, and the rise of charter schools and private school alternatives. The San Francisco Chronicle reported that SJUSD had the largest enrollment decline among the 10 biggest Bay Area school districts from 2019–20 to 2021–22: an 11% drop.
Crucially, while enrollment dropped 20%, the district maintained the same number of elementary schools (26) until this year's proposed closures. Half of those 26 elementary schools now serve fewer than 350 students. The smallest has fewer than 200 students.
Per-Pupil Spending: More Money for Each Student
Here's where the math gets really interesting. Because revenue keeps going up while enrollment keeps going down, the amount of money available per student has skyrocketed.
In 2014–15, the district had about $10,420 per student. By 2023–24, that figure rose to ~$19,390 per student — nearly double. The statewide average for unified school districts is around $18,400 per student. Even with the 2024–25 budget drop, SJUSD still spends ~$18,190 per student. If the district has more money per student than ever before, why does it need to close schools?
Federal Relief Funds: ESSER and Other Grants
Between 2020 and 2024, an unprecedented wave of federal money flowed into school districts across America to help them weather the COVID-19 pandemic. This money came in three rounds through the Elementary and Secondary School Emergency Relief Fund (ESSER).
| Round | Federal Law | Date | Total (National) | California Total | Deadline |
|---|---|---|---|---|---|
| ESSER I | CARES Act | Mar 2020 | $13.2B | ~$1.6B | Sep 2022 |
| ESSER II | CRRSA Act | Dec 2020 | $54.3B | ~$6.7B | Sep 2023 |
| ESSER III | ARP Act | Mar 2021 | $122.8B | ~$13.5B | Sep 2024 |
| Total | $190.3B | ~$23.4B |
California received approximately $23.4 billion in total ESSER funds — the most of any state. These funds were distributed to districts based on their Title I (low-income student) allocations. SJUSD received its share; the district's federal revenue line items jumped significantly during 2020–2024.
ESSER funds were meant to be used for: preventing COVID spread (PPE, ventilation, cleaning), addressing learning loss from school closures, mental health services, technology for remote learning, maintaining staffing levels, and summer/after-school programs. ESSER III specifically required at least 20% of funds go toward evidence-based programs to address learning loss.
All ESSER funds had to be obligated by September 30, 2024. This "fiscal cliff" means districts that used ESSER money for ongoing expenses — like hiring new staff — now face a funding gap. As Franklin-McKinley School District Board President George Sanchez noted about the broader impact: "Funding very much drives the curriculum in our schools... schools aren't receiving federal funding like they did during the height of the COVID-19 pandemic."
Other Notable Funding Sources
Approved by voters in 2016, this $72/year parcel tax generated about $5 million annually for eight years. It was used for teacher retention, academic programs, and staff salaries. It expired June 30, 2025. The district attempted to renew it with Measure A in a May 2025 special election, but voters rejected it. The election itself cost the district $2–3 million.
A general obligation bond approved in 2012 to repair and upgrade school facilities — classrooms, science labs, technology, safety, and energy systems. This money cannot be used for operations or salaries; it's strictly for buildings and infrastructure.
Approved by 64.7% of voters in November 2024, this massive bond will cost taxpayers about $81 million per year for approximately 30 years ($60 per $100,000 of assessed home value). It funds facility upgrades, employee housing construction (600+ units planned), and classroom modernization. SPUR noted that the district released no expenditure plan before putting it on the ballot.
Santa Clara County schools received about $20.9 million in lottery funds in Q2 of 2023–24 alone, with a cumulative total of nearly $1.9 billion since 1985. Lottery funds are meant to supplement — not replace — regular funding.
SJUSD collects developer fees on new residential and commercial construction within district boundaries. These fees are kept in a separate account and are meant to offset the cost of accommodating new students generated by new development.
Bonds & Parcel Taxes: What Voters Have Approved
Over the past 25 years, SJUSD voters have approved multiple bond measures and parcel taxes. Here's a summary of the major ones:
Combined, SJUSD voters have authorized nearly $1.87 billion in bond debt since 2002 — plus ongoing parcel taxes. The 2024 Measure R alone will cost taxpayers approximately $2.4 billion with interest over 30 years. Meanwhile, the district was also receiving hundreds of millions in annual property tax revenue, state funds, and federal pandemic relief. One Measure R opponent noted: "In 2012, we approved $290M for repairs... yet the district's now requesting an additional $1.15B."
School Closures: The "Schools of Tomorrow" Plan
In September 2025, the SJUSD Board of Education launched the "Schools of Tomorrow" initiative — a process to evaluate elementary schools for possible consolidation, closure, or boundary changes. The district initially released three options proposing to close up to 9 elementary schools. Over 6 weeks, the STIC cycled through 8 options — then on March 3, 2026, under intense community pressure, retired 5 of 6 remaining options and capped closures at a maximum of 4 schools. On March 26, 2026, the Board voted 3–2 to close five elementary schools effective the 2026–27 school year.
After delaying the original March 12 vote, the Board of Education voted 3–2 to close five elementary schools — all five are Title I schools serving a high share of low-income students and students of color:
- Canoas
- Empire Gardens
- Gardner
- Lowell
- Terrell
Hammer Montessori relocates from Galarza to Gardner. Reported student reassignments: Empire Gardens → Anne Darling · Canoas → Ernesto Galarza · Gardner → Horace Mann · Lowell → Washington (Special Day Class → Grant) · Terrell → Rachel Carson (Special Day Class → Reed). Families were notified of assignments by May 1.
How the board voted — Yes: José Magaña, Carla Collins, Teresa Castellanos · No: Brian Wheatley (VP), Nicole Gribstad. The board room erupted with "shame on you." Voting no, Wheatley said: "San Jose Unified is a unicorn… we are no longer financially affected by declining enrollment."
The day before the vote, 18+ community members filed a Uniform Complaint Procedures complaint alleging the process violated state and federal equity protections, structurally excluded the most vulnerable families, and forces children as young as 5 to walk up to 60 minutes to school. The district has 60 days to investigate; parents plan to appeal to the California Department of Education.
The district's stated reasons: enrollment declined 20% since 2017–18 (~6,000 fewer students); 12 of 26 elementary schools now have fewer than 350 students (doubled from a few years ago); the smallest school has fewer than 200 students; and small schools can't sustain counselors, nurses, art/music programs, or avoid combo-classes.
The District's "Ideal School" Definition
In September 2025, the Board created the Schools of Tomorrow Advisory Committee (STAC) to define the characteristics of an "ideal" elementary school. In November 2025, the Board accepted the STAC recommendation and created the Schools of Tomorrow Implementation Committee (STIC) to decide which schools to close. Here is what they defined:
Class sections per grade level:
- Standard schools (Structured English Immersion): 3 classes per grade level
- Schools with specialized programs (language immersion, bilingual): at least 2 classes per grade level
Minimum staffing for "ideal" schools:
- 1.0 FTE physical education teacher
- 0.5 FTE office assistant (in addition to full-time office manager and office specialist)
- 1.0 FTE campus supervisor
- Schools with Special Day Class or bilingual programs: additionally 1.0 FTE assistant principal
Consolidation thresholds (set by STIC):
- Schools without a bilingual program with 300 or fewer students (excluding SDC) = consolidation candidate
- Schools with a bilingual program with fewer than 4 classes per grade = consolidation candidate
- Maximum of 4 total consolidations (added later under community pressure)
The Board approved 9 evaluation criteria for the STIC to rank consolidation options:
- STAC's ideal elementary school recommendation
- Condition of school facilities
- Financial impacts
- Facility capacity and utilization
- Impacts on special programs (bilingual / Special Day Classes)
- Environmental factors (traffic, freeway proximity)
- Balance of pupil demographics
- Transportation needs
- Enrollment and attendance patterns
The STAC criteria set a minimum number of classes per grade but are completely silent on:
- Maximum class sizes — there is no cap, so "ideal" schools could have 35+ students per class
- Student-teacher ratios — the metric that research consistently links to educational outcomes
- Academic performance — test scores, graduation rates, and student growth are not part of the formula
- Community and family input — no mechanism for parents to weigh in on what makes their school ideal
The result: a school with 3 overcrowded classrooms per grade is "ideal," while a school with 2 well-resourced, high-performing classrooms is a closure candidate.
What the District Promises
SJUSD says affected schools will receive twice their usual funding during the transition year. Schools receiving new students will also get double funding. Bus service will be offered for students more than 1.5 miles from their new school. Three hours of free after-school activities will be provided. Staff positions will be preserved.
The Unanswered Questions: What Happens After Schools Close?
The district says closures will allow "better services" for students — but has not explained what those services are, how they will be funded, or why they require closing schools. Here are the critical questions the district has not answered:
The district has repeatedly stated that closures are "not motivated by financial considerations" but by "providing all students the best educational experience possible." Yet the district is running a $30.3M deficit. If there's no financial problem, what is the educational justification for uprooting thousands of children? And if there is a financial problem, why not say so?
The district claims smaller schools "can't sustain counselors, nurses, art/music programs." But it has never published a plan showing which specific services will be added to receiving schools after consolidation. Will there be more counselors? More nurses? New programs? How many, at which schools, and funded by what budget line? None of this has been specified.
The district has not released any projected savings from closures. Research consistently shows that school closures often cost more than expected — due to transportation, transition support, facility maintenance on empty buildings, and enrollment losses when displaced families leave the district entirely. Where is the cost-benefit analysis?
The district has said nothing about what will happen to the physical properties of closed schools. Will they be sold? Leased? Repurposed? Left vacant? In November 2024, voters approved $1.15 billion in Measure R bonds for school facilities — with no disclosure that the district was planning to close up to 9 of those schools. Parents are asking: did we just approve bonds to renovate buildings that the district already planned to shut down?
The district promises "double funding" and "bus service" for one year. But what happens in year two? When the transition funding ends, receiving schools will have significantly larger student populations with no additional resources. How will the district support emotionally disrupted students — especially Special Day Class students with IEPs who lose familiar routines, staff, and environments? The district's own data shows 100% of students denied alternative enrollment across all options are students with IEPs.
National research on school closures shows they rarely deliver promised benefits. A University of Chicago study found that closures led to no academic improvement for displaced students and significant negative effects on their social-emotional well-being. The National Education Policy Center found that closures disproportionately harm low-income students and students of color — the exact populations SJUSD's own data shows will bear the greatest burden.
California law (Education Code § 44949 and § 44955) requires school districts to notify certificated employees (teachers, counselors, nurses, librarians) of potential layoffs by March 15 each year. If the district misses this deadline, it cannot lay off those employees for the following school year.
This is why the Board vote was originally set for March 12 — exactly three days before the layoff deadline. The entire rushed timeline — the February 3 announcement of options, the compressed STIC meetings, the March 3 recommendation — was designed to get a closure vote in just in time to send layoff notices by March 15. On March 3, the STIC delayed its recommendation and requested an extension to March 26 — but the March 15 layoff deadline has already passed, raising the question of whether precautionary layoff notices were sent anyway.
For classified employees (custodians, office staff, instructional aides), Education Code § 45117 requires 60 days' written notice before layoffs take effect — meaning notices for a July 1 effective date would need to go out by May 1.
The community deserves to know: is this timeline driven by what's best for students, or by a staffing deadline? If the district truly believes closures are the right decision, why not take the time to get it right — even if that means waiting until the following year?
The bottom line: the district is asking the community to accept irreversible school closures based on promises it hasn't defined, savings it hasn't calculated, a post-closure plan it hasn't written — and a timeline driven not by student needs, but by a staffing layoff deadline.
What Parents Are Saying
Parents and community members are pushing back hard. Many note that some of the schools targeted for closure are high-performing, high-demand neighborhood schools. As one parent wrote to the board about Simonds Elementary: "Closing a school that is appropriately sized, academically strong, and program-rich directly contradicts the framework the district has outlined."
February 10, 2026 STIC Meeting: What Changed
At the February 10 meeting, the Schools of Tomorrow Implementation Committee took significant action:
Option 3 was retired — the committee voted to remove it from consideration.
Three new options were added:
- Option 4: Combines Options 1 and 2. Elevates transportation safety metrics (8.4, 7.8.4a, 7.8.4b). Protects SDC programs that have already been moved in the last 7 years. Keeps Criterion 1 (ideal school size) as priority.
- Option 5: Requires that any closure keeps all students moving together and SDC programs stay with the student body. Treats Pre-K the same as general student body.
- Option 7: Deprioritizes 7-year projected metrics in favor of immediate adoption metrics. Focuses on first-order criteria.
Option 6 failed — a motion to keep SDC students together (excluding SDC preschool) did not pass.
March 3, 2026: The Turning Point
Under intense community pressure — with parents threatening legal action and a taxpayer injunction to freeze Measure R bond funds — the STIC took dramatic action:
- Retired 5 of 6 options — all large-scale closure plans (Options 1, 1.2, 2, 2.2, 4, 5, 5.2, 7) scrapped
- Capped closures at 4 schools maximum — down from up to 9
- New criteria: only schools with fewer than 300 students and without bilingual programs
- Directed staff to develop two new proposals for the March 10 meeting
- Requested extension to March 26 (original Board vote was March 12)
STIC Chair Patrick Bernhardt: "I believe that we have an urgent need to take action to remedy our smallest schools. But I think anything where 9 schools close...is not the right action for us."
Under the new criteria, only these elementary schools are eligible for closure consideration:
Anne Darling · Canoas · Empire Gardens · Horace Mann · Lowell · Rachel Carson · Selma Olinder · Terrell
However, the bilingual program exclusion may protect some of these schools. The STIC directed staff to limit proposals to a maximum of 4 closures from this list.
A Mercury News investigation (Feb 28, 2026) found that SJUSD's methodology echoes Oakland Unified's 2022 closure plan, which triggered a civil rights investigation by California Attorney General Rob Bonta. Bonta found Oakland's plan "would have a statistically significant disproportionate impact on Black and low-income elementary students, as well as some students with disabilities."
Like Oakland, SJUSD relied on enrollment size and facility conditions — the same methodology. The Mercury News found: 10 of 27 potential closure schools enroll above-average shares of Hispanic/Latino students; 11 schools serve more English learners than the district average; and proposed closures heavily target downtown and East San Jose while largely sparing Almaden Valley.
Oakland rescinded all closures in January 2023 after the AG's investigation.
Feb 24: New options with full metrics released. Sub-options 1.2, 2.2, 5.2 introduced. ✓
Mar 3: STIC retired 5 of 6 options. Directed staff to develop new options (max 4 closures, under 300 students, no bilingual schools). ✓
Mar 5: Cancelled.
Mar 7: Board Public Hearing — consider STIC recommendation. 855 Lenzen Ave.
Mar 10: Special Board session (4:30 PM) + STIC meeting (6:00 PM). New options to be presented. 855 Lenzen Ave, Room 150.
Mar 12: Original Board vote date — likely delayed.
Mar 26: New deadline requested by STIC for final recommendation.
Map: Schools at Risk of Closing
The maps below show all options that were considered before the March 3 reset. All of these options have been retired. They remain here for reference — to show the scope of what the district proposed before community pressure forced a course correction. New options (max 4 closures, under 300 students) will be presented at the March 10 STIC meeting.
The district says it needs to close schools because enrollment has dropped. But revenue has increased every single year, and per-pupil funding has roughly doubled in a decade. The district became a Basic Aid district in 2020–21, meaning its revenue is tied to property taxes — not enrollment. It received massive federal ESSER funds. Voters just approved a $1.15 billion bond.
So the question families and taxpayers are asking is: If there's more money per student than ever before, why can't smaller schools be sustained? Where exactly is all this money going?
Independent Audit: The District's "Ideal School" Formula Is Fundamentally Flawed
We downloaded the exact metrics spreadsheets the District posted for Options 1, 2, 3, and Status Quo (V.i. Metrics Calculations — both Immediate and 7-Year variants) and audited the actual Excel formulas behind the closure analysis. We also analyzed the official February 10 Metrics Summary Tables comparing all options across 11 criteria. What we found is deeply concerning: the methodology used to justify closing up to 9 schools contains structural flaws that produce unreliable results — and the district's own aggregate data shows closures make things worse on most metrics.
Flaw 1: Binary Classification — The Mathematical Cliff
The District's primary metric — "percent of students in ideal schools" (Metric 1.1) — is a binary on/off switch. A school is either "ideal" or "not ideal." There is no gradual improvement, no nuance, and no real measure of educational quality. The label can flip based on very small numerical changes caused by rounding inside the spreadsheet.
From the actual spreadsheet data:
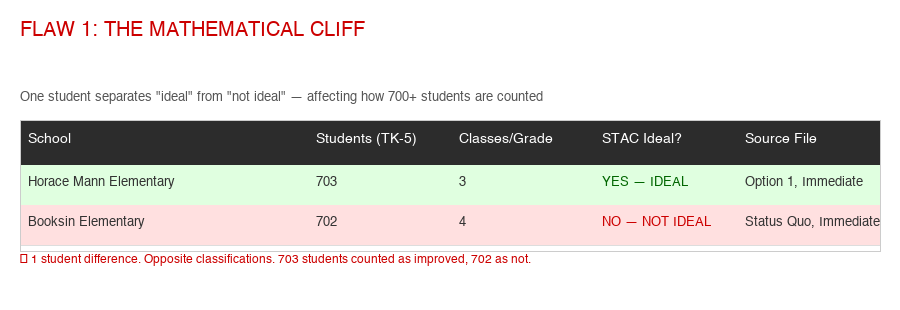
Horace Mann with 703 students at 3 classes per grade is classified as IDEAL. Booksin with 702 students at 4 classes per grade is classified as NOT IDEAL. A single student separates the two. But in the "percent of students in ideal schools" metric, all 703 Horace Mann students are counted as "improved" while all 702 Booksin students count as zero. That is not a sound educational methodology — it is a mathematical cliff.
In the Feb 24 Rationale document (Appendix A, p.13), the district itself acknowledges: "Students are scored under metrics 1.1, 7.1.1a, and 7.1.1b either as being at a school of the ideal size or not being at a school of the ideal size. In other words, the scoring has a binary component. Small differences in enrollment for schools that are very close to either the bottom of the enrollment range for the ideal size or the top of the enrollment range for the ideal size can sometimes have a measurable impact." This is exactly the flaw we identified above — yet the district continues to use this binary formula as the primary driver of all closure decisions.
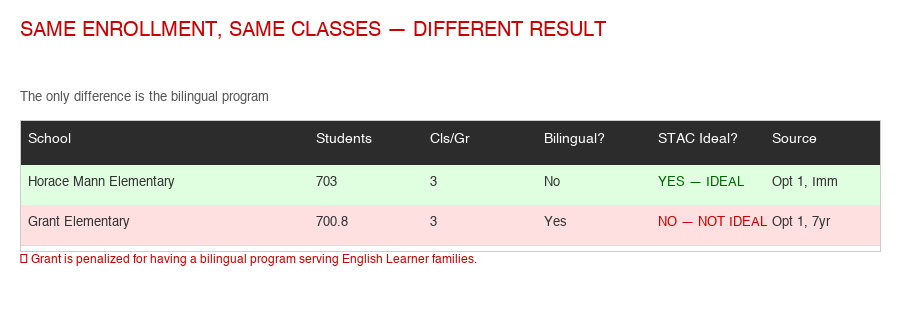
Flaw 2: The Bilingual Penalty — Structural Discrimination
Our audit uncovered a 100% consistent pattern across all options and all timeframes: schools with bilingual programs are held to a higher enrollment standard than non-bilingual schools.
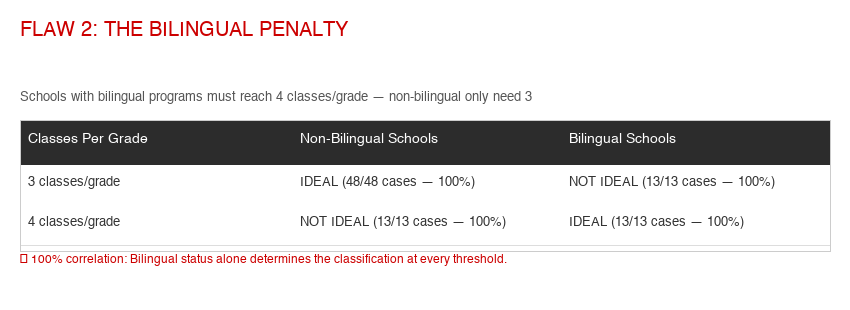
Non-bilingual schools are classified as "ideal" at 3 classes per grade (~530+ students). Bilingual schools must reach 4 classes per grade (~780+ students) — a 47% higher enrollment threshold. This is a perfect, 100% correlation across 61 data points: every single non-bilingual school at 3 classes is "ideal," and every single bilingual school at 3 classes is "not ideal."
Who is affected? Bilingual schools serve the district's most vulnerable students:

The five bilingual schools in SJUSD (Gardner, Merritt Trace, Walter L. Bachrodt, Washington, and Willow Glen) serve 2,530 students with a 59.7% Unduplicated rate (low-income, English Learner, and foster youth). Non-bilingual schools average 43.0%. The STAC "ideal" formula forces these schools — the ones serving the children who need the most support — to reach a higher enrollment threshold to be considered "ideal." This is structural discrimination embedded in a spreadsheet.
Flaw 3: Schools Penalized for Strong Enrollment
The formula defines "ideal" as a single point — not a range. Having too many students is penalized just as much as having too few. Across all options, there are 12 instances where a non-bilingual school with 4 classes per grade (700–839 students) is classified as "NOT IDEAL" — not because the school is struggling, but because the formula considers it too large.
For example, Simonds Elementary at 839 students in Option 2 is classified as NOT IDEAL — not because it is struggling, but because the formula considers it "too large." A school with 4 classes per grade and strong community demand is treated identically to a school that is failing. The STIC formula has no concept of a healthy range — only a single target point, and anything above or below it is scored as zero.
Flaw 4: False Precision in 7-Year Projections
The 7-year enrollment projections that determine whether a school crosses a threshold are calculated to 13+ decimal places:
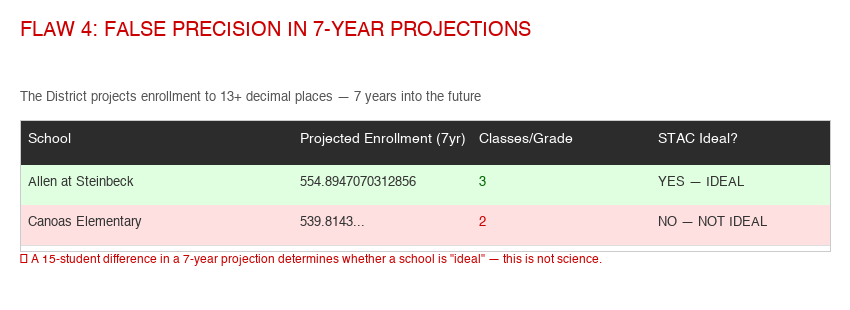
Allen at Steinbeck is projected at 554.8947070312856 students in 2032–33. Canoas is projected at 539.8 students. A 15-student difference in a 7-year projection — subject to birth rates, housing prices, migration, and countless unpredictable factors — determines whether a school is classified as "ideal" or not. No enrollment model can predict with this precision. Yet these numbers are presented as the basis for irreversible school closures.
Flaw 5: The Full Picture — All 8 Options Exposed by the District's Own Metrics
The district's Feb 24 Quick Metrics Comparison Tables now cover all 8 options plus Status Quo — including the staff-recommended "improved" variants 1.2, 2.2, and 5.2. When you look beyond the single "% ideal" metric, every closure option makes nearly everything else worse:
Safety & Community Impact (Immediate Analysis)
| Metric | SQ | Opt 1 | 1.2 | Opt 2 | 2.2 | Opt 4 | Opt 5 | 5.2 | Opt 7 | Takeaway |
|---|---|---|---|---|---|---|---|---|---|---|
| % at "ideal" schools (1.1) | 24% | 51% | 56% | 65% | 60% | 55% | 47% | 42% | 70% | Based on flawed binary formula |
| Facility quality (1.2, 0–12) | 9.9 | 8.7 | 8.6 | 8.6 | 8.6 | 8.9 | 9.6 | 9.3 | 8.9 | SQ wins |
| Walk to school (8.2) | 87% | 79% | 79% | 76% | 77% | 76% | 75% | 72% | 76% | SQ wins; 5.2 worst |
| Crossing 55mph roads (8.4) | 12% | 13% | 12% | 16% | 14% | 9% | 18% | 18% | 17% | Opt 5/5.2 worst |
| Undup crossing 55mph (7.8.4a) | 17% | 17% | 16% | 21% | 18% | 11% | 26% | 26% | 25% | Opt 5/5.2: 26% |
| Students separated from peers (11.2) | N/A | 832 | 1,216 | 563 | 747 | 1,479 | 0 | 530 | 1,245 | Opt 4 worst: 1,479 |
| Per-student plant costs (3.1) | $950 | $711 | $711 | $647 | $647 | $750 | $815 | $782 | $723 | Closures save costs |
The district's own data shows there is no good closure option. Option 4 has the best safety (9% crossing 55mph — even better than Status Quo) but the worst community cohesion (1,479 students separated). Options 5/5.2 keep communities together (0 separated) but are the least safe (26% of unduplicated students crossing 55mph roads). Option 7 scores highest on the flawed "ideal" metric (70%) but drops to just 56% at 7 years. The Status Quo still wins on facility quality, walkability, and overall safety.
The district recommends replacing Options 1 and 2 with "improved" variants 1.2 and 2.2. But the data tells a different story: Option 1.2 separates 1,216 students from their peers — 46% more than Option 1's 832. Option 2.2 separates 747 students vs. Option 2's 563 (33% more). Worse still, Option 1.2 increases the unduplicated share of separated students from 45% to 54%, meaning the "improvement" disproportionately harms the most vulnerable families.
Flaw 6: Disproportionate Impact — The Equity Bombshell (Now Confirmed Across All 8 Options)
The district's own Criterion 7 (demographic balance) and Criterion 11 (transition impacts) data — now available for all 8 options — reveal a devastating and universal equity failure:
| Metric | District | Opt 1 | 1.2 | Opt 2 | 2.2 | Opt 4 | Opt 5 | 5.2 | Opt 7 |
|---|---|---|---|---|---|---|---|---|---|
| Undup % forced to change schools (7.7a) | 47% | 64% | 64% | 54% | 54% | 57% | 70% | 59% | 66% |
| IEP % forced to change schools (7.7b) | 15% | 21% | 21% | 16% | 16% | 15% | 20% | 18% | 20% |
| Students separated from peers (11.2) | N/A | 832 | 1,216 | 563 | 747 | 1,479 | 0 | 530 | 1,245 |
| Undup % NOT offered alternatives (7.11.3a) | 47% | 68% | 68% | 71% | 71% | 69% | 70% | 70% | 66% |
| IEP % NOT offered alternatives (7.11.3b) | 15% | 100% | 100% | 100% | 100% | 100% | 100% | 100% | 100% |
| Undup walk zone (7.8.2a) | 79% | 71% | 71% | 70% | 70% | 68% | 62% | 61% | 69% |
Under every single option — including the district's newest "improved" variants — 100% of students required to move whose families are not offered alternative enrollment opportunities are students with IEPs (metric 7.11.3b). This is not a flaw in one option; it is built into the methodology itself. Meanwhile, Option 5 — designed to "keep communities together" — has the worst equity burden: 70% of displaced students are unduplicated (vs. 47% district average), and only 62% of unduplicated students can walk to school (down from 79%).
What This Means: The Legal and Ethical Case Against Proceeding
School closures are irreversible. They destabilize students, fracture communities, and permanently reduce trust in public education. When the underlying methodology is flawed — and the data shows it is — the conclusions drawn from it cannot be considered reliable. The Board must not vote on school closures until these methodological flaws are independently reviewed and corrected.
Legal protections exist. California law and federal civil rights statutes provide multiple grounds to challenge closures based on flawed or discriminatory methodology:
- AB 1912 (Education Code § 41329): Requires districts to conduct an equity impact analysis before any closure, including whether the closure has a "disproportionate effect on any demographic" — particularly English learners. A methodology that systematically penalizes bilingual schools may fail this requirement. The California Attorney General issued statewide guidance (April 2023) explicitly warning that closures must not reinforce segregation or disproportionately impact any student group.
- Oakland Unified precedent (2022–2024): When OUSD voted to close 7 schools — with Black students comprising 50%+ at four targeted schools vs 20% district-wide — the ACLU filed a complaint with the Attorney General, who opened an investigation and found the closures "would have disproportionately impacted Black and low-income elementary students." OUSD rescinded all closures in January 2023.
- National Teachers Academy v. Chicago Public Schools (2018): A court issued a preliminary injunction — the first in national history to stop a school closure on racial discrimination grounds — when CPS's own criteria did not justify the closure and the impact fell disproportionately on minority students.
- Save Our Schools v. Barstow USD (2015): A California appellate court voided a school closure because the district "could not have properly determined an exemption applied because it did not have the necessary statistics before it." Data must support the decision.
- Title VI of the Civil Rights Act / Equal Educational Opportunities Act: A methodology that systematically penalizes bilingual schools serving English Learner and low-income families creates a disparate impact claim under federal law. The EEOA (20 U.S.C. § 1703) provides a private right of action for families.
Before the Board votes, the community should demand:
1. An independent, third-party audit of the STIC metrics spreadsheets and the STAC "ideal school" formula.
2. Removal of the bilingual penalty from the methodology — bilingual schools should not face a higher enrollment threshold.
3. A methodology that uses a continuous scale, not a binary on/off switch, to measure school quality.
4. Transparency on why the formula treats 4 classes per grade as "not ideal" for non-bilingual schools — punishing schools with strong enrollment and community demand.
5. A formal equity impact analysis compliant with AB 1912, reviewed by the California Department of Justice.
Analysis: Do the Closures Make Financial Sense — or Reveal Mismanagement?
The district frames school closures as an inevitable response to declining enrollment. But when you examine the financial evidence, a different picture emerges — one that suggests the real problem isn't too few students, but how the district manages its growing resources.
The District's Argument vs. the Data
District claim: "We have 6,000 fewer students than we did in 2017–18. We can't sustain 26 elementary schools."
What the data shows: General fund revenue grew from $370M (2017–18, est.) to $462M (2024–25 LCAP) — a 25% increase — during the same period enrollment fell 20%. Per-pupil general fund revenue rose from roughly $12,100 to approximately $18,200. The district became a Basic Aid district in 2020–21, meaning its funding is tied to property values, not headcount. Even without a single additional student, revenue will continue rising as Silicon Valley property values increase. Yet the district is budgeting a $30.3M deficit — spending $492M while projecting only $462M in revenue.
Consider a school with 250 students. At $18,200 per pupil in general fund revenue (2024–25 LCAP), that school generates approximately $4.55 million in revenue. Even if the fully-loaded cost to operate an elementary school is $3–4 million annually (staffing, facilities, utilities), the school is more than paying for itself. The district has not published school-by-school cost data to refute this math.
Signs of Financial Mismanagement
Multiple independent sources paint a picture of a district with serious financial governance problems:
1. The Grand Jury called the district "adrift" — and the board rejected the warning. In June 2024, the Santa Clara County Civil Grand Jury published a 42-page report titled "District Adrift" after conducting 80 interviews and reviewing 500 documents. The report found high leadership turnover (54% of principals lost in two years vs. 22% at comparable districts), lack of student wellness centers, safety gaps, and overall lack of transparency. Crucially, the Grand Jury noted these problems echoed the district's own 2023 School Climate Survey — meaning the board already had internal data showing the same issues. In a five-hour board meeting in July 2024, the board voted unanimously to reject nearly all findings. The Superintendent dismissed the report as "unrepresentative, misleading and inaccurate." Even the Teachers Association president acknowledged: "There was no finding in this report that I have not already had conversations about with district leaders." In other words: they knew, and they chose not to act.
2023: SJUSD's own School Climate Survey identifies trust, morale, and leadership concerns among staff and parents.
June 2024: Grand Jury publishes "District Adrift" — confirming the same problems with 80 independent interviews.
July 2024: Board unanimously rejects nearly all Grand Jury findings. Superintendent calls report "misleading."
2024–25: District adopts a $30.3M deficit budget with $0 in reserve for economic uncertainties.
2025: Unions reveal $30M+ in health benefit underfunding since 2017–18. Voters reject Measure A parcel tax.
Late 2025–2026: District announces plans to close up to 9 elementary schools.
2. $30+ million in alleged health benefit underfunding. Three employee unions claim the district quietly changed its formula for calculating benefit contributions, shortchanging employees by over $30 million since 2017–18. The district's CBO acknowledged the discrepancy.
3. Spending growth that outpaced both enrollment and inflation. From 2019–20 to 2023–24, expenditures rose 34% ($366M → $492M) while enrollment fell 13% and the employee count actually increased 0.4%. Inflation during that period was approximately 20–22%. Spending growth materially exceeded inflation — even without accounting for the enrollment decline.
4. No expenditure plan for $1.15B Measure R bond. SPUR, the respected Bay Area policy organization, noted that the district put a massive $1.15 billion bond on the ballot in 2024 without publishing a detailed expenditure plan showing taxpayers exactly how the money would be spent.
5. Voters rejected the parcel tax renewal. In May 2025, voters said "No" to renewing Measure Y's $72/year parcel tax. The Mercury News editorial board recommended rejection, citing the district's failure to demonstrate fiscal responsibility. The election itself cost the district $2–3 million to conduct.
6. Zero reserves for economic uncertainties — below state-required minimum. SACS filings show SJUSD's designated Reserve for Economic Uncertainties has been $0 for at least two consecutive years (2022–23 and 2023–24). California requires districts of SJUSD's size to maintain at least 2% of expenditures in available reserves (~$9.5M). SJUSD's total unrestricted reserves were just $1.3M (0.27%) in 2023–24 — an $8.3M shortfall below the state minimum.
Recommendations for Financial Reform
1. Independent Financial Audit: The community should demand an independent, third-party forensic audit of SJUSD's finances — not the standard annual audit performed by auditors the district selects, but a comprehensive review commissioned by the County Office of Education or Board of Supervisors examining where every dollar has gone over the past 5 years.
2. School-by-School Cost Transparency: Before closing any school, the district should publish the actual cost to operate each individual elementary school — including staffing, facilities, utilities, and overhead — alongside the revenue each school generates through per-pupil funding. Without this data, any closure decision is arbitrary.
3. Administrative Cost Reduction: With enrollment down 20% but employee count up 0.4%, the district should demonstrate it has first exhausted administrative efficiency measures before asking communities to sacrifice their neighborhood schools.
4. ESSER Accountability Report: A complete, line-item accounting of all ESSER funds received and spent — including whether any one-time funds were used for ongoing expenses — should be made public.
5. Bond Expenditure Plan: The district should publish a detailed, site-specific expenditure plan for the $1.15B Measure R bond funds before making any expenditures.
Political Recommendations
For City Council and Mayor's Office: While the city government does not directly control the school district, school closures profoundly affect neighborhoods, property values, public safety, and community cohesion. The Mayor and Council should use their bully pulpit to demand fiscal transparency from SJUSD before closures proceed.
For State Legislators: Senator Dave Cortese and Assemblymember Ash Kalra should consider introducing legislation requiring Basic Aid districts to publish annual transparency reports showing how excess property tax revenue above the LCFF guarantee is being used — and mandate school-by-school cost accounting before any closure action.
For the County Board of Supervisors: The Board should consider using its authority to request the County Office of Education conduct an independent review of SJUSD's fiscal management, following up on the Grand Jury's findings.
For SJUSD Board Candidates (2026 elections): Any candidate for the Board of Education should commit to completing a full independent audit and publishing school-by-school cost data before continuing the closure process.
How Neighboring Districts Compare
SJUSD isn't the only district in Santa Clara County dealing with enrollment decline. But its response — and its financial trajectory — stand out. Let's look at how nearby districts are handling similar challenges.
Cupertino Union School District (CUSD)
CUSD, which also serves parts of San José, faced severe enrollment decline — losing more than 4,900 students since 2015–16. It closed three elementary schools in 2022 (Regnart, Meyerholz, and consolidated Muir). However, CUSD is now running a $26 million deficit in FY 2024–25 with a projected $11 million deficit in 2025–26. Like SJUSD, it's a Basic Aid district. Unlike SJUSD, it has already cut school sites — and is still in fiscal crisis. This raises the question: did closures actually solve anything?
Campbell Union School District (CUSD)
Campbell Union serves communities adjacent to SJUSD — including Campbell, Los Gatos, portions of San José. It operates 13 schools (9 elementary, 2 middle). While it has also experienced enrollment pressure, it has not proposed closures. It received "green" ratings across all categories on the California School Dashboard. The difference? Budget discipline and appropriately-sized operations.
Campbell Union High School District (CUHSD)
The high school district serving much of the SJUSD feeder area operates 6 high school campuses with 8,600+ students. It is the only district in Santa Clara County to receive "green" ratings across all categories on the state accountability dashboard. No closures. No fiscal crisis. It demonstrates that well-managed districts can thrive even in the same economic environment.
Santa Clara Unified School District (SCUSD)
Serving 15,400+ K-12 students across 56 square miles (overlapping with portions of San José), Santa Clara Unified has not announced mass school closures despite similar regional pressures. The district emphasizes maintaining neighborhood schools as community anchors.
Enrollment decline is real and regional. But not every district is closing schools. Campbell Union (K-8) and Campbell Union High School District are thriving without closures. Meanwhile, Cupertino Union — which already closed three schools in 2022 — is now running a $26 million deficit. School closures are not a magic solution. The real issue is whether a district manages its growing revenue responsibly. SJUSD's revenue has grown 66% in a decade — far more than most neighboring districts — yet it's the one proposing the most dramatic closures.
Questions That Deserve Answers
Based on the publicly available data, here are the questions the community should be asking SJUSD leadership:
1. Administrative Spending: What percentage of the budget goes to district administration vs. direct classroom instruction? How has this ratio changed over the past 10 years? How many administrators have been added while enrollment declined?
2. ESSER Accountability: Exactly how much ESSER money did SJUSD receive across all three rounds? What was it spent on? Were any ESSER funds used for ongoing expenses (like staff positions) that now need to be replaced? Has the district published a complete accounting?
3. The $30 Million Health Benefits Question: Three employee unions allege the district has underfunded health and welfare benefits by over $30 million since 2017–18. Has this been resolved? Where did that money go instead?
4. Property Tax Windfall: Since becoming a Basic Aid district in 2020–21, how much excess property tax revenue (above the LCFF guarantee) has SJUSD received? How was this additional money used?
5. Bond Spending Transparency: For the 2012 Measure H bond ($290M) and the 2024 Measure R bond ($1.15B), where is the detailed accounting of how each dollar has been or will be spent?
6. Cost Per School: What is the actual annual cost to operate one elementary school? If per-pupil revenue is $21,000+ and a school has 200–350 students, that's $4.2–$7.4 million per school in generated revenue. What is the operating cost of keeping that school open?
7. Grand Jury Recommendations: The 2024 Santa Clara County Civil Grand Jury found the district "adrift" with leadership failures. The board rejected nearly all findings. Have the recommended reforms been implemented?
8. Closed School Properties: What happens to school buildings after closure? Will they be sold or leased? If so, who benefits from those proceeds?
What Parents, Teachers & Neighbors Are Saying
These are the people whose lives will change if schools close. Their stories matter more than any spreadsheet.
February 2026
January 2026
February 2026
February 2026
February 2026
Your story matters. Share what these closures mean for your family.
Share Your StoryStories may be published with your permission. Email: behindsiliconvalley@proton.me
Take Action: Your Voice Matters
One click opens a pre-written email to all five SJUSD Board members, the Superintendent, and the Schools of Tomorrow committee. Edit it and make it your own.
OPEN EMAIL TO BOARD →The committee accepting community input before their recommendation to the Board:
EMAIL SCHOOLSOFTOMORROW@SJUSD.ORG →The more people who see the financial data, the harder it is for the district to ignore. Share with every SJUSD parent you know.
Know Your Board: Voting Record Tracker
On March 26, 2026 the five elected board members voted 3–2 to close five schools (Yes: Magaña, Collins, Castellanos · No: Wheatley, Gribstad). Here is their public voting record on key financial accountability issues.
If you're a parent, teacher, or community member affected by the proposed school closures, here are the officials who represent you and how to reach them.
SJUSD Board of Education (Direct Authority)
On March 26, 2026 the Board voted 3–2 to close five schools effective 2026–27. A civil-rights complaint over the closures is now pending. Board meetings are held on the 1st and 3rd Thursday of each month at 6:00 PM at 855 Lenzen Ave, San José. Public comment is still permitted — submit a "Request to Speak" card before the meeting.
City of San José — Mayor Matt Mahan
While the mayor does not control SJUSD, school closures directly impact city neighborhoods, walkability, property values, and community safety. Contact: mayoremail@sanjoseca.gov
California State Legislature
State Senator Dave Cortese (D) — Senate District 15
Covers most of San José. Cortese previously served on the SJUSD-area school board (East Side Union HSD).
Capitol: (916) 651-4015 · District: (408) 558-1295 · sd15.senate.ca.gov
Assemblymember Ash Kalra (D) — Assembly District 25
Covers the majority of San José including downtown.
Capitol: (916) 319-2025 · District: (408) 277-2525 · a25.asmdc.org
U.S. Congress
SJUSD spans two congressional districts. Your representative depends on your specific address:
CA-16 (southern/western SJUSD areas — 95124, 95118, 95120, etc.): Use house.gov/representatives to find your specific representative.
CA-18 — Rep. Zoe Lofgren (D) (downtown/east SJUSD areas — 95110, 95112, 95113, 95116, etc.):
Washington: (202) 225-1904 · San José office: (408) 271-8700 · lofgren.house.gov
U.S. Senators
Sen. Alex Padilla (D): (202) 224-3553 · padilla.senate.gov
Sen. Adam Schiff (D): (202) 224-3841 · schiff.senate.gov
Santa Clara County
County Superintendent of Schools — Dr. Mary Ann Dewan
The County Office of Education has oversight responsibilities and can conduct reviews of district finances.
sccoe.org · (408) 453-6500
Santa Clara County Board of Supervisors
Can request investigations and apply political pressure. Find your supervisor at: sccgov.org/sites/bos
1. Demand a math plan & a transparent curriculum adoption — At Board meetings, ask for SJUSD's plan to fix math outcomes and an open, parent-inclusive process to replace SpringBoard. Request your own child's math placement data and know your rights under Ed Code § 51224.7.
2. Email the Board — Use the one-click email button above. Personalize it with your family's story.
3. Attend a Board meeting — 1st & 3rd Thursdays, 855 Lenzen Ave, 6:00 PM. Submit a "Request to Speak" card. Bring neighbors.
4. Support the civil-rights complaint — Parents have filed a Uniform Complaint and plan to appeal to the California Department of Education. Add your story and stay organized.
5. Request a formal investigation — Ask Senator Cortese and the County Board of Supervisors to request an independent audit of SJUSD finances.
6. Share this page — Forward behindsiliconvalley.com to every SJUSD parent, teacher, and neighbor you know.
7. Write a physical letter — Mailed letters carry more weight than emails. Send to: SJUSD Board of Education, 855 Lenzen Ave, San José, CA 95126.
Thanks for your support — it helps keep this work going.
☕ Support us on Ko-fi →What Parents & the Community Did
The closures went through, but not quietly. Through the Schools of Tomorrow process, San José families organized, showed up, and put their objections on the public record. This is a record of that effort — and of the fight that is still going.
- Gathered 12,830+ petition signatures. Across Change.org petitions to keep neighborhood schools open — directed at the Board, the City Council, and Mayor Matt Mahan.
- Packed Board and STIC meetings. Parents filled public-comment sessions for months; at the final March 26 vote the board room erupted with "shame on you" after the 3–2 decision.
- Forced a major reset. Sustained pressure pushed the STIC to retire 5 of 6 closure options on March 3 and cap closures at four schools — down from the original nine.
- Filed a civil-rights complaint. The day before the vote, 18+ families filed a Uniform Complaint Procedures complaint alleging the process violated state and federal equity protections; they plan to appeal to the California Department of Education (this fight is ongoing).
- Emailed and wrote the Board demanding a financial audit and transparency, and raised the parallel to Oakland's plan that drew a state civil-rights warning.
The closure decision is made — but the complaint is still pending, and the math fight described at the top of this page is just beginning. Staying informed and showing up is still how families protect what comes next.
A Note on Data Sources and Accuracy
This analysis relies on a mix of primary official sources and secondary reporting. We want to be fully transparent about which is which, and where figures should be verified independently before being used in formal advocacy.
What Comes Directly from Official Sources
The following data points are confirmed from SJUSD's own website, the California Department of Education (CDE), or the National Center for Education Statistics (NCES):
| Data Point | Value | Primary Source | Notes |
|---|---|---|---|
| Total Revenue | $532,224,000 | NCES CCD (FY 2021–22) | ⚠ This is FY 2021–22 all-funds, not 2023–24 |
| GF Revenue 2024–25 | $462,171,756 | SJUSD LCAP Budget Overview (CDE) | General fund projected revenue |
| GF Revenue: LCFF | $390,906,437 (85%) | SJUSD LCAP Budget Overview (CDE) | Incl. $23.3M supplemental/concentration |
| GF Revenue: Other State | $46,595,948 (10%) | SJUSD LCAP Budget Overview (CDE) | |
| GF Revenue: Local | $10,543,905 (2%) | SJUSD LCAP Budget Overview (CDE) | |
| GF Revenue: Federal | $14,125,467 (3%) | SJUSD LCAP Budget Overview (CDE) | |
| GF Expenditures 2024–25 | $492,473,846 | SJUSD LCAP Budget Overview (CDE) | ⚠ $30.3M DEFICIT BUDGET |
| Revenue: Federal | $46.2M (9%) | NCES CCD (FY 2021–22) | Elevated due to ESSER funds |
| Revenue: Local | $360.4M (68%) | NCES CCD (FY 2021–22) | Property tax dominant (Basic Aid) |
| Revenue: State | $125.6M (24%) | NCES CCD (FY 2021–22) | |
| Total Expenditures | $450,328,000 | NCES CCD (FY 2021–22) | |
| Per-Pupil Revenue | $20,728 | NCES CCD (FY 2021–22) | Based on 25,676 ADA |
| Instruction % | 59% | NCES CCD (FY 2021–22) | $244.9M of current expenditures |
| Staff Count | 2,568.76 FTE | NCES CCD (2024–25) | |
| Enrollment 2024–25 | 25,409 | Ed-Data (CDE partnership) | Most current available |
| Enrollment 2023–24 | 25,976 | NCES CCD / Ed-Data | |
| Basic Aid Status | Since 2020–21 | SJUSD Fiscal Services | sjusd.org/about/fiscal |
| Enrollment decline ~6,000 | Since 2017–18 | SJUSD Schools of Tomorrow | District's own claim |
| Revenue 2014–15 | $320.9M | SVTA (citing CDE data) | Per-pupil: $10,416 |
What Comes from Secondary/News Sources
The following data points are drawn from news reporting and editorial analysis. While we believe them to be reliable (the Mercury News editorial board and SVTA have strong credibility), they have not been independently verified against SJUSD's unaudited actuals or CDE SACS filings:
| Data Point | Claim | Source |
|---|---|---|
| Spending 2019–20 | $366M | Mercury News Editorial, Mar 2025 |
| Spending 2023–24 | $492M | Mercury News Editorial, Mar 2025 |
| Spending increase | 34% in 5 years | Mercury News Editorial, Mar 2025 |
| Employee count change | +0.4% despite −13% enrollment | Mercury News Editorial, Mar 2025 |
| $30M+ benefits underfunding | Alleged since 2017–18 | La Voz News, May 2025 (union claim) |
| Year-by-year revenue (table) | $321M–$532M (2014–2024) | Interpolated from SVTA, NCES, Ed-Data |
| Enrollment 2008 baseline | ~35,000 | KRON4, Dec 2025 |
| Per-pupil spending | $16,520/student | U.S. News (citing NCES FY 2021–22) |
Several sources (including U.S. News Education) cite SJUSD's total revenue as "$532 million." Investigation reveals this figure comes from the NCES Common Core of Data for fiscal year 2021–22 and represents all-funds revenue (general fund + capital + special funds). FY 2021–22 also had elevated federal revenue due to ESSER pandemic relief funds ($46.2M vs. the normal ~$14M). The district's own LCAP Budget Overview for 2024–25 shows general fund revenue of $462M — lower than $532M because it excludes non-general funds. The true comparison is: general fund revenue of $462M vs. general fund expenditures of $492M = $30.3M deficit.
What We Recommend
Community members using this analysis for advocacy, board testimony, or media engagement should:
1. Download SJUSD's official Unaudited Actuals for 2022–23 and 2023–24 from the district's budget archive and verify revenue/expenditure figures directly.
2. Use Ed-Data.org (the CDE/EdSource/FCMAT partnership) for the most current general fund data — though note that Ed-Data's financial tables require JavaScript and the most recent year may lag by 1–2 years.
3. Reference the NCES Common Core of Data for federally-reported figures, and always note the fiscal year (currently FY 2021–22).
4. File a Public Records Act (PRA) request with SJUSD for specific data not available online, such as school-by-school operating costs or detailed ESSER expenditure reports. Instructions: sjusd.org/about/district-information/pra
Where This Data Comes From
This analysis is based entirely on publicly available official data. All figures are approximate and drawn from the following sources. Community members are encouraged to verify independently.
- SJUSD Fiscal Services — Budget documents and financial reports
sjusd.org/about/fiscal - SJUSD Past Budget Reports Archive — Annual budgets, interim reports, unaudited actuals
sjusd.org/about/fiscal/financial-budget-reports-archive - SJUSD LCAP Budget Overview 2024–25 (CDE-hosted PDF) — GF Revenue $462M, Expenditures $492M, revenue breakdown
cdeunifiedstoragewest.blob.core.windows.net/lcaps/...pdf - SJUSD – California Public School Funding — Basic Aid district explanation
sjusd.org/about/fiscal/california-public-school-funding - SJUSD – Schools of Tomorrow — Closure initiative, enrollment data
sjusd.org/about/schools-of-tomorrow - SJUSD – Measure R — $1.15B bond details
sjusd.org/about/measurer - SJUSD – Parcel Tax — Measure Y details
sjusd.org/about/fiscal/parcel-tax - SJUSD – Developer Fee
sjusd.org/about/fiscal/developer-fee - SJUSD – District Information — Revenue breakdown, bond history
web.sjusd.org/who-we-are/district-information - SJUSD – Measure H Reports
sjusd.org/.../measure-h-financial-performance-reports - Ed-Data.org (CDE Partnership) — Revenue, expenditure, enrollment from CA Dept. of Education
ed-data.org/district/Santa-Clara/San-Jose-Unified - California Dept. of Education – District Profile
cde.ca.gov/sdprofile/details.aspx?cds=43696660000000 - CA Dept. of Education – ESSER I Funding
cde.ca.gov/fg/cr/esser.asp - CA Dept. of Education – ESSER III FAQs
cde.ca.gov/fg/cr/esseriiifaqs.asp - U.S. Dept. of Education – ESSER Fund
ed.gov/...elementary-and-secondary-school-emergency-relief-fund - U.S. News Education – SJUSD Profile — $532M revenue, $16,520/student
usnews.com/.../san-jose-unified-104657 - Mercury News Editorial, March 25, 2025 — $366M→$492M spending, employee data
mercurynews.com/2025/03/25/editorial-voters-reject... - Mercury News, February 5, 2026 — "Up to 9 schools could close"
mercurynews.com/2026/02/05/up-to-9-san-jose-unified... - San José Spotlight, August 2024 — Bond measure, lottery data
sanjosespotlight.com/.../bond-measure-could-fund-teacher-housing... - San José Spotlight, November 2024 — Voter approval of school measures
sanjosespotlight.com/.../silicon-valley-voters-pass-multiple... - East Bay Times, Feb 24, 2025 — Measure A parcel tax renewal
eastbaytimes.com/2025/02/24/...additional-5-million... - East Bay Times, Jul 25, 2024 — Board rejects Grand Jury
eastbaytimes.com/2024/07/25/...rejects-findings... - La Voz News, May 22, 2025 — $30M+ health benefits underfunding
lavozdeanza.com/news/2025/05/22/sjusd-funding-mismanaged - KRON4, December 22, 2025 — Enrollment decline and closures
kron4.com/.../declining-enrollment-could-force... - KRON4, February 2026 — Three options released
kron4.com/.../san-jose-elementary-schools-facing... - Hoodline, February 2026 — School shakeup analysis
hoodline.com/2026/02/san-jose-school-shakeup-looms... - Santa Clara County Civil Grand Jury, 2024 — "District Adrift" report
Grand Jury Report (PDF) - Silicon Valley Debug — Grand Jury summary
siliconvalleydebug.org/.../grand-jury-report-confirms... - SF Chronicle, April 2022 — Bay Area enrollment comparison
sfchronicle.com/.../San-Francisco-lost-about-7-of-its... - EdSource – LCFF Database — SJUSD Basic Aid status
edsource.org/local-control-funding-formula-database/san-jose-unified.html - EdSource, October 2025 — Property tax inequality
edsource.org/2025/property-tax-driven-education-disparity/742256 - EdSource, June 2023 — CA ESSER spending rates
edsource.org/2023/.../692344 - FutureEd, April 2024 — California ESSER analysis
future-ed.org/california-esser-spending - SPUR Voter Guide, 2024 — Measure R analysis
spur.org/voter-guide/2024-11/sj-measure-r-school-bond - Opportunity Now SV, Oct 2024 — Candidate reactions
opportunitynowsv.org/.../measure-r - Silicon Valley Taxpayers Association — Revenue data, Measure Y
svtaxpayers.org/2016-san-jose-unified-school-parcel-tax - PublicSchoolReview – SJUSD — Per-pupil spending, state median
publicschoolreview.com/.../san-jose-unified-school-district/... - Fox & Hounds Daily / David Crane, 2017 — Benefits analysis
foxandhoundsdaily.com/2017/04/dissecting-san-jose-unified - Pandemic Oversight (PRAC) — ESSER state breakdown
pandemicoversight.gov/.../states-received-1895-billion... - Ballotpedia — Santa Clara County ballot measures
ballotpedia.org/Santa_Clara_County,_California_ballot_measures